1. Review – Silver’s soaring flight and sudden crash

Silver in US dollars, daily chart from December 31, 2025. Source: Tradingview
The fourth quarter, and especially the last weeks of 2025, were dominated by silver, which significantly outperformed not only gold, but almost all other asset classes. On Monday, December 29, the price of silver reached a new all-time high of USD 84.03 immediately after the start of trading, before dramatically collapsing by 16.07% to USD 70.52 during the day.
This sharp correction followed a breathtaking rally in the weeks before: Since the last significant low of USD 45.55 on October 28, silver had gained +84.48% within two months. In addition to clear signs of overheating, profit-taking and increased margin requirements are likely to have triggered the sudden price decline.
China’s intervention and the geopolitical turning point
Behind the short-term enormous volatility, however, lies a deeper structural change: China has shaken the tight global silver market by subjecting silver exports to state approval from January 1, 2026 – a geopolitical chess move with potentially far-reaching consequences.
With the reclassification of silver as a strategic “dual-use” material, Beijing is signaling that silver is not only an industrial metal, but also a security-relevant raw material. The step is strongly reminiscent of China’s approach to rare earths about a decade ago, when export quotas also led to the strengthening of domestic industries and the increase in global dependence.
A new power logic in the precious metal markets
Since China controls most of the world’s silver processing, this new regulation gives the country a significant position of power in the supply chain – especially in view of the sharply increasing demand from the solar energy, electromobility, semiconductor and defense technology sectors.
These developments are already reflected in market prices: The price difference between physical silver in Shanghai and paper contracts on the COMEX was recently around USD 6 per ounce – a premium that indicates significant shortages in the physical market.
Gold, on the other hand, has been somewhat more restrained in recent weeks and only followed the price of silver. Nevertheless, it also reached a new all-time high of USD 4,550 on Christmas Day. At the start of the week, however, prices also fell sharply yesterday. The low point was only found at USD 4,302 (-5.41%), from which the gold price has already recovered quickly by over USD 100.
Overall, the last weeks of 2025 have revealed a clear separation between paper and physical precious metal markets and once again underlined the geopolitical importance of precious metals as well as raw materials. The silver boom is therefore far more than a price speculation – it is an expression of the new power logic of a multipolar global economy, in which control over gold means trust and over silver means influence. The coming months will show whether China’s step remains a short-term market distortion or marks the beginning of a long-term structural reassessment for one of the most important industrial metals of our time.
2. Chart Analysis Gold in US Dollars
2.1 Weekly chart: Weekly candle with bearish reversal pattern?
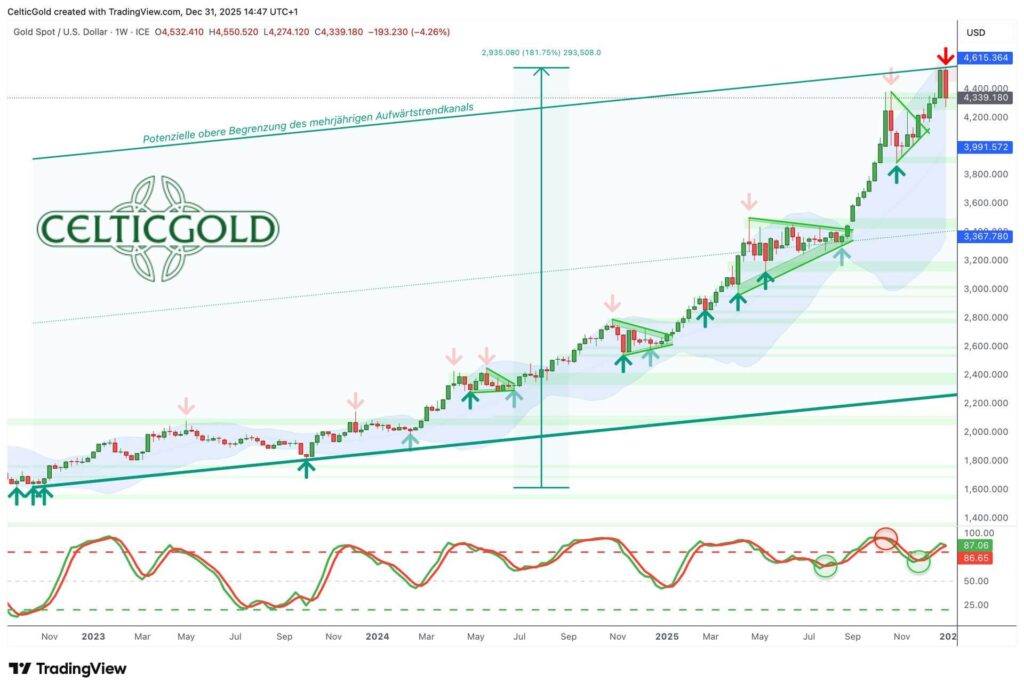
Gold in US dollars, weekly chart from December 31, 2025. Source: Tradingview
Since the significant triple bottom at USD 1,615 in autumn 2022, the weekly chart has basically only known the way up. Although there have been repeated consolidation phases lasting several weeks and even months in retrospect, the bottom line is a brilliant increase of almost 300% within a little more than 3 years!
Based on the new all-time high of USD 4,550, a so-called “bearish engulfing pattern” is now emerging for the first time in connection with the sharp setback since Monday morning in this phenomenal upward trend. This two-candle reversal pattern occurs when the body of the second (red) candle completely encloses that of the previous green one, signaling a possible end to the upward trend. It typically occurs after longer periods of increase and shows that buyers are losing influence while sellers are increasingly gaining strength. If the bulls do not succeed in improving the picture by the end of the week on Friday, the probability of a downward reversal would increase significantly.
In the worst case, the entire upward movement from USD 1,615 to USD 4,555 could now be corrected. Then potential price targets would be conceivable up to the area of around USD 3,500. Here run both the middle trend line of the higher-level upward trend channel and the lower Bollinger Band (currently USD 3,369). In addition, the gold price had already consolidated in this area for about four months this year.
In view of the steep upward movement in silver in recent weeks, a significant intermediate high in precious metals would not be surprising. However, the weekly stochastic for the gold price has not yet turned, so that – similar to the last 21 months or so – a consolidation at a high level would also be possible. In this “best-case” scenario, the gold price is likely to quickly find the low of the “cold shower” between USD 4,120 and USD 4,200.
Overall, the weekly chart remains bullish for the time being. The potential candle reversal pattern should already be confirmed or negated on Friday evening – and thus maßgeblich prezeichnen the further course for the coming months. Should the reversal be confirmed, the brilliant rally could be facing a well-deserved breather due to the excessive euphoria as well as the massive margin increases!
2.2 Daily chart: Rising 50-day line as a logical target
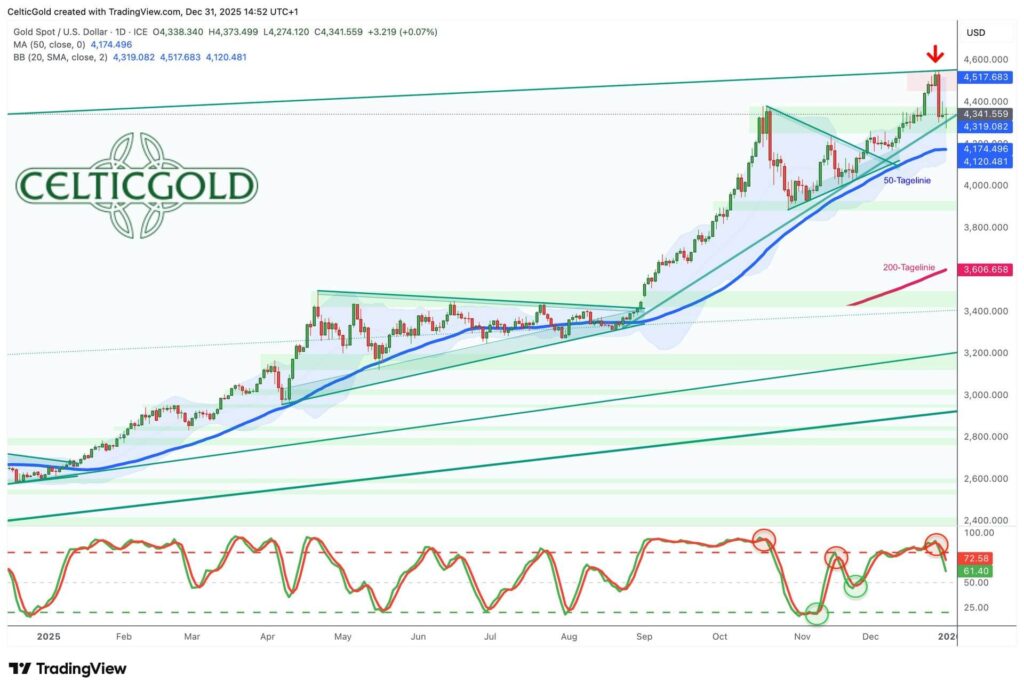
Gold in US dollars, daily chart from December 31, 2025. Source: Tradingview
On the daily chart, the gold price has risen from USD 3,386 to USD 4,550 within two months since the sharp setback at the end of October – an increase of around USD 665 or +17%. Compared to the explosive rally in silver (+84.85%), this increase seemed modest and showed a rather tough, consistent, but also slightly tired character.
The sharp setback since Monday night has put an end to the upward trend of the last two months. The price slump does not seem to be over yet, because the daily stochastic has just activated a sell signal. There is still a good distance to the oversold zone.
The rising 50-day line (USD 4,175), which has more or less absorbed all setbacks since spring 2024, would be the logical target this time as well. In connection with the lower Bollinger Band (USD 4,120) on the daily chart and a downward trend line from the October high, a fall back to around USD 4,150 to USD 4,175 would not be a surprise.
In summary, the daily chart is bearish. The mark of USD 4,300 was already briefly undercut this morning. The next support zone is waiting between around USD 4,320. Below that, the way is clear to the 50-day line (USD 4,175) and the lower Bollinger Band (USD 4,120). On the upside, only an increase back above USD 4,410 and especially USD 4,450 will help to turn the battered picture around.
3. Futures Market Structure Gold

Commitments of Traders Report for the Gold Future from December 16, 2025. Source: Sentimenttrader
The publication of the Commitment of Traders (CoT) data was interrupted due to the US government shutdown from October 1 to November 12, 2025. Most recently, the data was submitted bit by bit, making a coherent and current analysis impossible. The CFTC plans to resume the normal publication cycle from January 2026, which means that complete and current CoT data on gold will not be available again until then.
Currently, the COT data from December 16, 2025 is available. Accordingly, commercial traders held a cumulative short position of 274,358 gold future contracts at the closing price of around USD 4,302. This commercial short position is too high in the long-term comparison and should rather be interpreted as a warning signal.
However, the Anglo-Saxon futures and paper gold market has lost control over gold price discovery in recent years due to strong physical demand from Asia – especially from China. The recent drastic margin increases are likely to have initiated the sell-off, however. These latest margin increases on the COMEX for gold futures were announced at the end of December 2025 and came into effect on December 29. The CME Group raised the initial margins for gold futures (COMEX 100 oz, GC) to USD 22,000 (maintenance) or USD 24,200 (for HRP/Spec) per contract. This adjustment was made due to increased volatility and the sharp price increases and requires traders to have additional liquidity.
Overall, the CoT report is negative based on the last 22 years.
4. Gold Sentiment
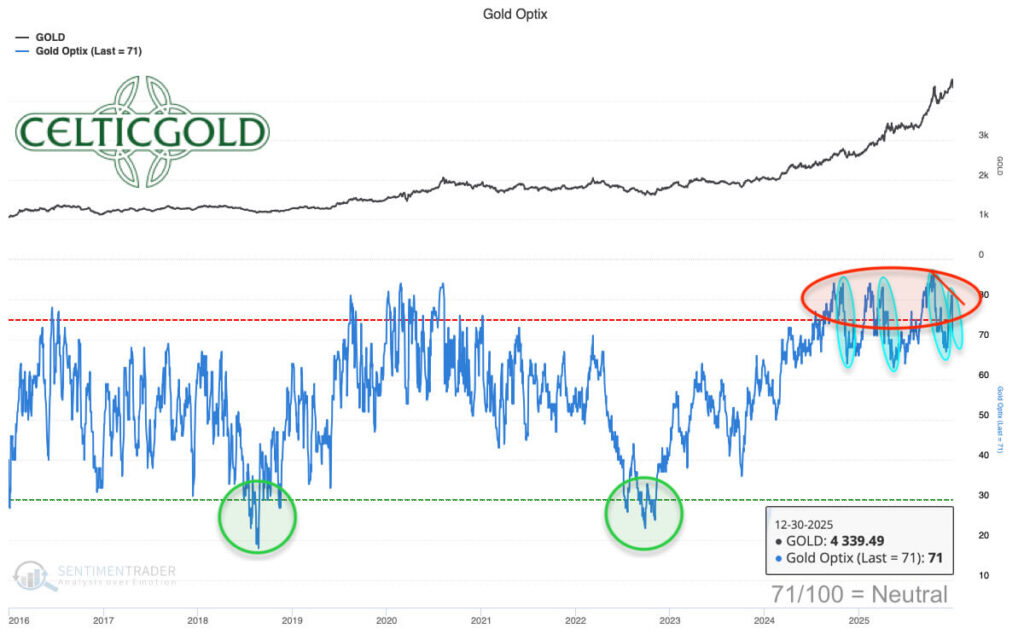
Sentiment Optix for Gold from December 30, 2025. Source: Sentimenttrader
The sharp setback since the beginning of the week once again feels like a cold shower and has already cooled the overheated sentiment to an Optix value of 71. However, the last high in sentiment on the gold market was not quite as euphoric as the one on October 21. Therefore, it remains unclear for the time being whether a cold shower will be enough this time, or whether a significantly larger cleansing of sentiment is necessary before the next increase.
In summary, sentiment has already fallen back into the neutral zone, but the cold shower does not seem to be quite over yet. Ideally, the Optix turns upwards again above 55. Otherwise, the probability of an extended correction increases sharply.
5. Gold Seasonality
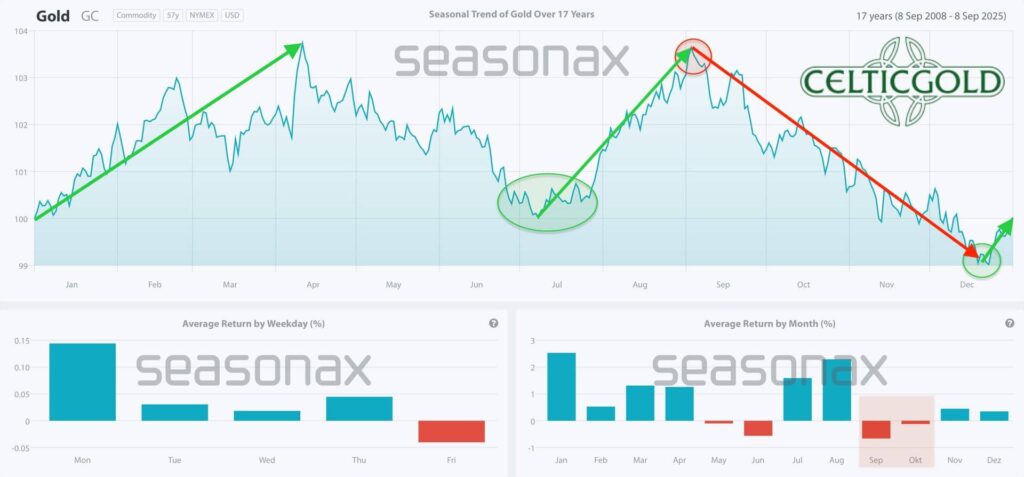
Seasonality for the gold price over the last 17 years from September 8, 2025. Source: Seasonax
Right on time for the targeted seasonal turning point, the gold price has risen sharply again since mid-December! Together with the price explosion in silver, however, the precious metals seem to have overshot the mark somewhat in a very short time. Nevertheless, seasonality provides green signs into spring.
In particular, the Chinese New Year 2026, also called the Spring Festival, could attract large groups of buyers looking for gold gifts in the run-up and from February 17. It is possible that January will be unusually weak due to the ongoing setback, before the Chinese New Year then provides for the seasonally typical price increases in February.
Overall, the seasonal traffic light is green until at least March.
6. Macro update – Silver as an industrial hegemon, gold as a reserve anchor
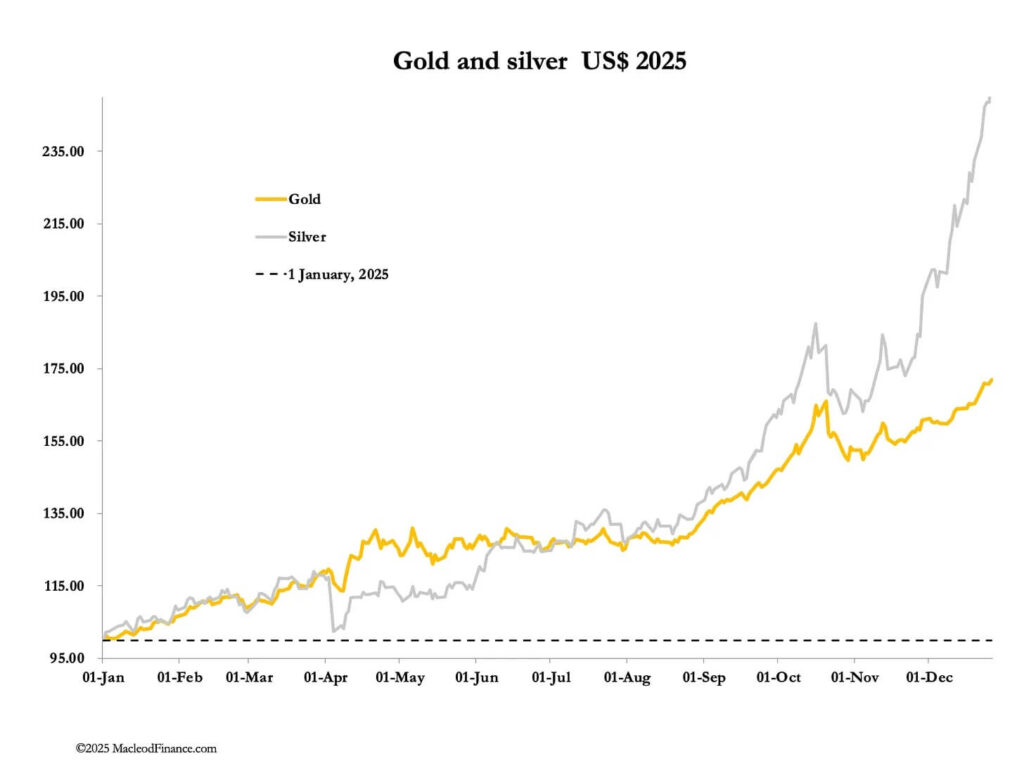
Gold and silver in US dollars in 2025, from December 26, 2025. Source: Alasdair MacLeod
After a sensational boom, precious metal prices are ending 2025 with extreme volatility. While the course of the year was marked by new all-time highs in gold, silver and platinum, the sharp correction in recent days is making for a disappointing end to the year.
The price of silver initially reached a new all-time high of USD 84.03 on December 29, before falling by over -16% to USD 70.52. The gold price also came back from USD 4,550 to USD 4,274.
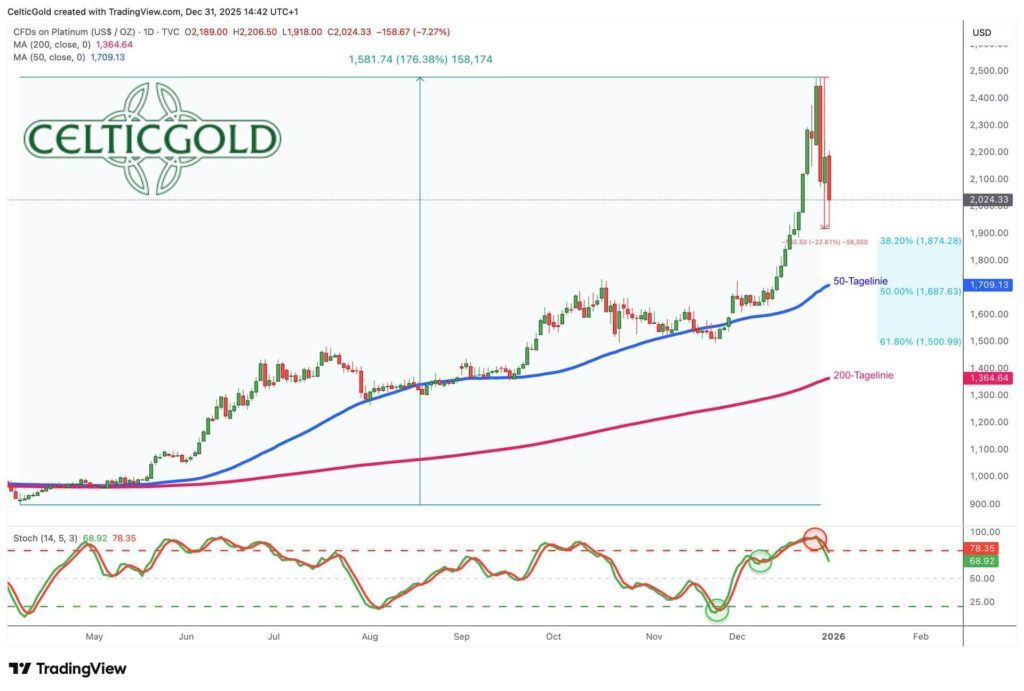
Platinum in US dollars, daily chart from December 31, 2025. Source: Tradingview
Platinum has been hit particularly hard, falling from its new all-time high of 2,525 by over -25% to USD 1,891. These extreme movements reveal the deep divide between paper prices on the COMEX (Commodity Exchange) in New York City and the physical markets in the Middle East and Asia.
Margin increases – Echo of the Hunt Brothers era

CME Group Margin Increases, dated December 30, 2025. Source: NoLimits
Not surprisingly, the CME Group (Chicago Mercantile Exchange), the world’s largest operator of derivatives exchanges, aggressively increased COMEX margins on December 31. The maintenance margin for silver rose by 30% to USD 32,500, followed by platinum (+25%) and palladium (+22%). This is the second such increase within a week and aims to take profits and force liquidations in order to slow down or break the strong upward momentum and protect the “naked shorts” of Western banks.
The COMEX’s emergency measure in January 1980 was historically similar to end the silver speculation of the Hunt brothers. At that time, the brothers Nelson Bunker Hunt and William Herbert Hunt had attempted to control the silver market through massive purchases of physical silver and futures contracts (up to 69% of the COMEX open interest), which drove the silver price from under USD 2 (1973) to around USD 50 (1980).
Silver Rule 7: Lessons from 1980
On January 7, 1980, the COMEX finally introduced the “Silver Rule 7” to end the speculation, imposing strict restrictions on purchases on margin (credit). Position limits of only 3 million ounces per trader and later even only “Liquidation Only” trading were also introduced. So you could no longer buy new long positions. This forced existing positions to be offset against shorts and prevented further purchases. The rule triggered a price crash, culminating in “Silver Thursday” on March 27, 1980, when the price of silver fell by over 50% to USD 10. The Hunts could no longer service the margin calls, lost billions and had to file for bankruptcy. The whole thing led to lasting reforms such as stricter limits and CFTC monitoring.
China’s silver export stop: Geopolitical game changer
In contrast, China’s export restrictions on silver from January 1, 2026 mark a geopolitical turning point, which is likely to more than counteract the COMEX’s efforts. As the world’s largest processor, Peking already controls the supply chain for solar, EVs and semiconductors, which is exacerbating the physical shortage and promoting backwardation between London Spot and COMEX futures. The West has lost control, and price discovery has already migrated to Dubai, Shanghai and Mumbai, where physical demand dominates. Although the USA still has the deepest capital markets, a virtual paper market without physical goods is of less and less interest to the rest of the world.
BRICS diversification and gold corridors
Instead, more and more central banks – especially those of the BRICS states – are actively diversifying away from the US dollar and strengthening their reserves with physical assets. To this end, China is building the “gold corridors” via the Shanghai Gold Exchange for an alternative reserve system that will undermine dollar dominance in the long term. This strategy uses the intrinsic scarcity of gold as a neutral store of value in an era of declining fiat credibility. At the same time, it creates a dedollarized parallel economy in which raw materials serve as a currency alternative.
Gold remains the indispensable anchor of trust in the financial system, while silver is becoming the strategic raw material of the industrial future. Geopolitically, the battle between the USA and China will continue to escalate. The USA is shifting its focus to Latin America, while China dominates manufacturing and almost all of Asia. Global liquidity is increasingly flowing into real assets and raw materials.
Multipolar power struggle: USA vs. China
In summary, the turbulence at the end of 2025 does not mark the end of the secular bull market in precious metals, but the dramatic transition to a new era of price formation in which the physical reality of the East overtakes the paper illusion of the West.
While COMEX and CME are desperately trying to save the shorts with margin hikes and historical rules such as Silver Rule 7, China’s strategic export controls and demand from the BRICS countries are dictating the true value creation. The result is a multipolar shift in power that cements gold as a reserve anchor and silver as an industrial hegemon.
7. Conclusion: Precious metals – A slap in the face at the turn of the year

The 65-year race between gold and silver, dated December 29, 2025. Source: Mining Visuals
The volatility at the end of 2025 – with silver’s high of USD 84 and subsequent 16% crash as well as gold’s correction from USD 4,550 to USD 4,274 – does not mark the bursting of a bubble, but the final break between COMEX paper prices and physical reality in the East. The CME margin hikes of up to 30% reveal a desperate maneuver to protect the short positions of Western banks, while China’s export stop from January 2026 is strangling supply chains for solar and EV demand and cementing backwardation in the silver market.
From a chart perspective, however, the gold price is threatened by a bearish “engulfing pattern” on the weekly chart, which is why a cautious, skeptical start to the new year is advisable.
Best-Case Scenario
Should the looming signal be averted by a strong weekly close and the price only consolidate at a high level, the low at approximately $4,175 to $4,200 USD will occur in the coming days or weeks. After that, targets at approximately $5,000 to $5,200 USD remain realistic until spring or early summer 2026.
Worst-Case Scenario
In the event of a larger correction, however, the new downward trend will extend over weeks: After a weak January, the positive seasonality in February and March could bring a recovery, which, however, fails below the all-time highs ($4,550 USD for gold, $84 USD for silver). Only later in the year would targets around $3,500 USD be achievable.
Investors should primarily remain physically positioned and use deep pullbacks as a further entry opportunity.
Florian Grummes
Precious Metal and Crypto Expert
www.midastouch-consulting.com
Free Newsletter
Source: www.celticgold.de