


1. Review
Since the panic low on February 6, 2026, and a bottom price of 59,930 USD, Bitcoin has been attempting to stabilize for nearly two months now. So far, this has only resulted in a short-lived recovery up to 76,013 USD, which quickly collapsed again in the currently extremely difficult geopolitical environment. The bottom line remains a sideways movement primarily between approximately 65,000 and 70,000 USD. Fluctuations in the crypto sector turned out to be surprisingly moderate given the geopolitical upheavals and the sometimes heavy price losses on the equity and precious metal markets.
However, the sector has been in a bear market or “crypto winter” for six months now, meaning that the already minimal risk appetite could hardly be decimated further by the external shock. Nevertheless, Bitcoin remains a risk asset highly correlated with US stock indices.
2. Chart Analysis Bitcoin in US Dollars
2.1 Weekly Chart: Bitcoin: Correction Not Yet Complete
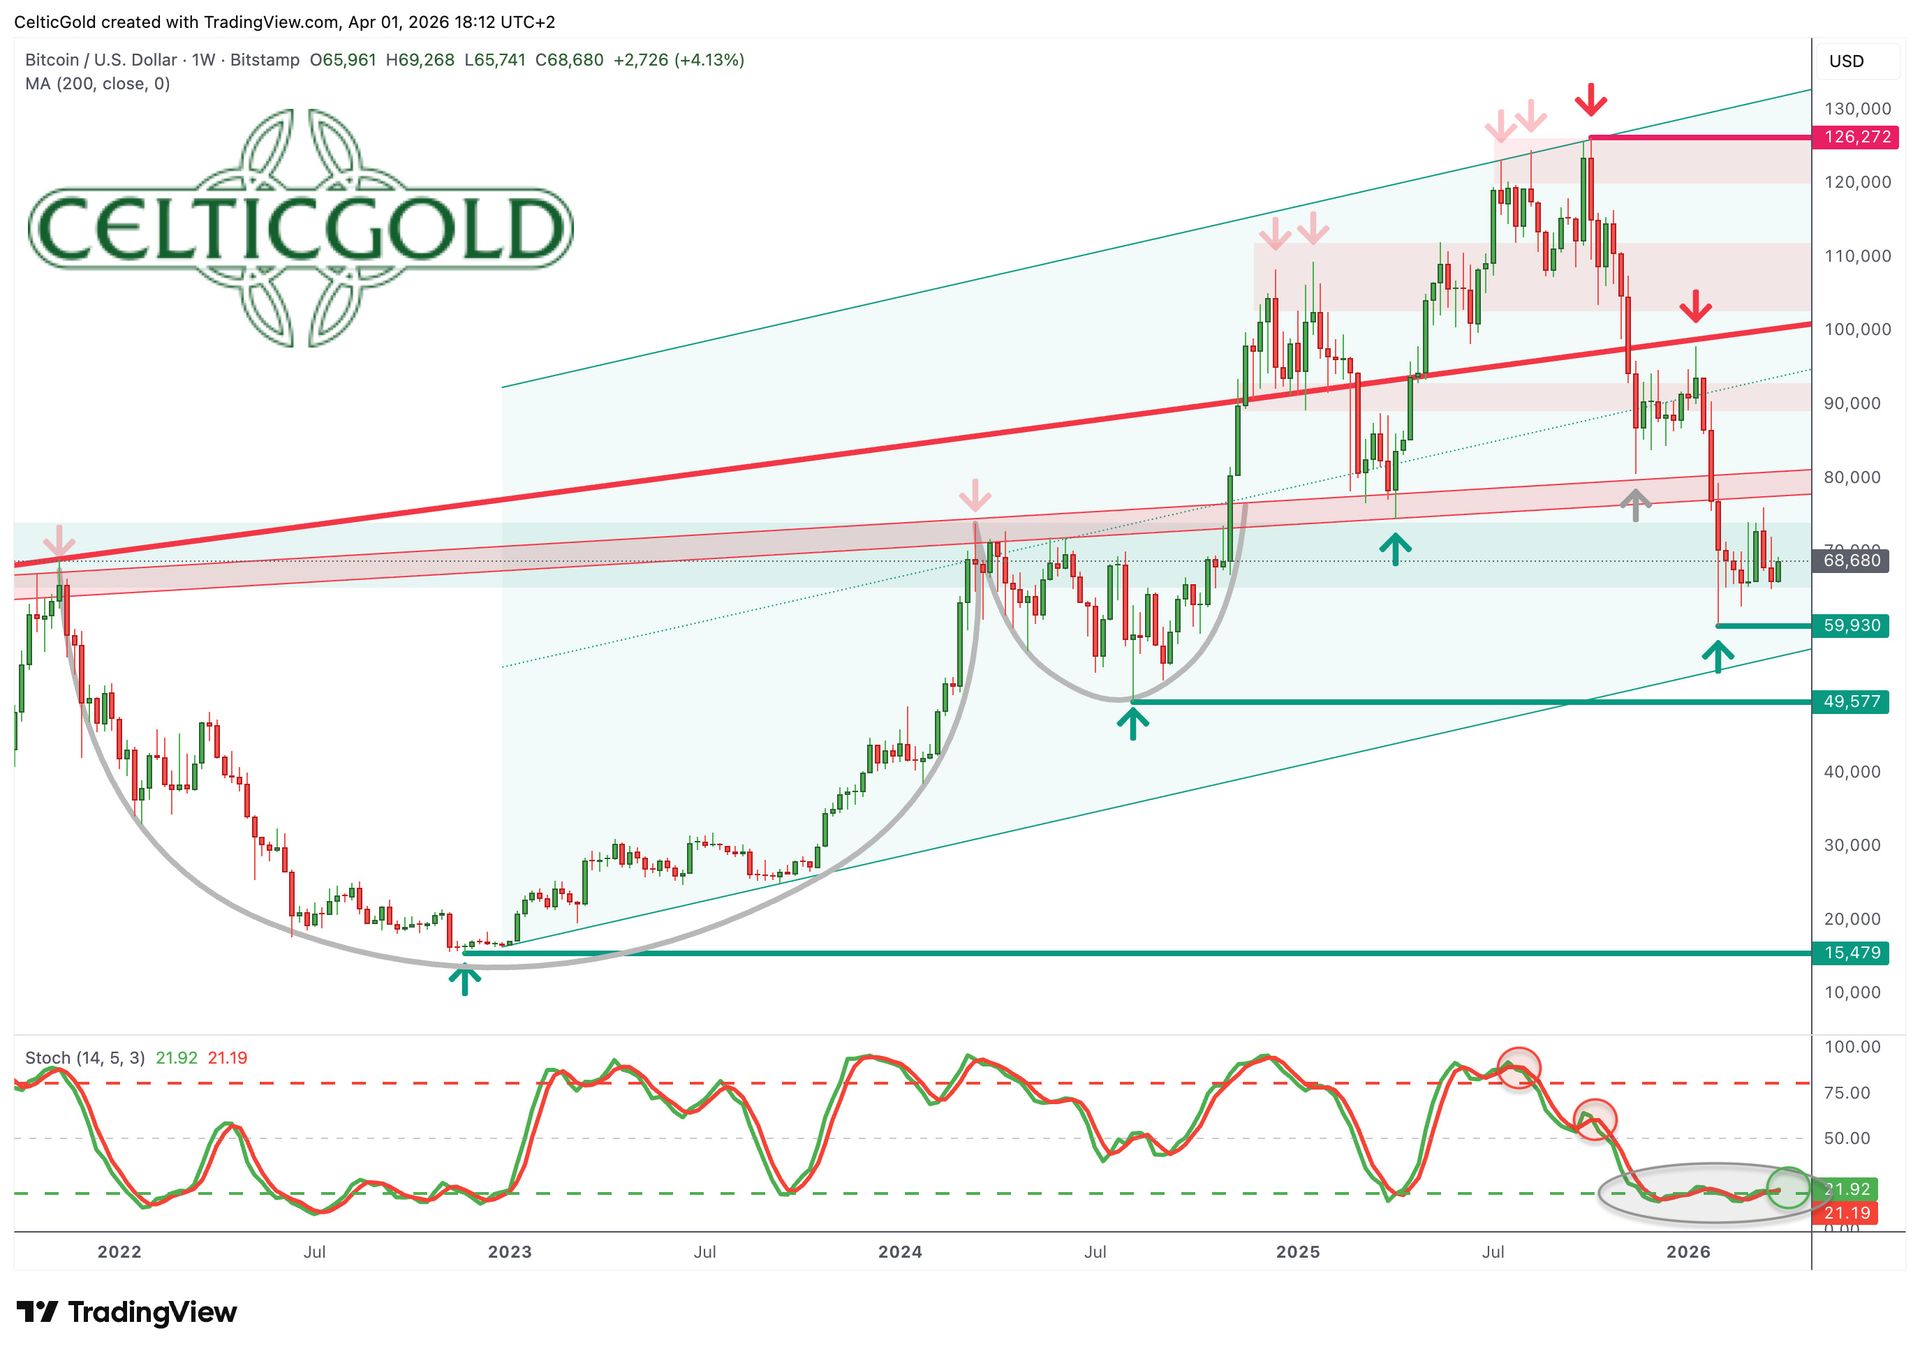
Bitcoin in USD, weekly chart from April 1, 2026. Source: Tradingview
From the all-time high on October 6, 2025, at 126,272 USD to the current low point of the correction on February 6, 2026, Bitcoin lost around 52.5% of its value within just four months. In previous crypto winters (bear markets), losses were significantly higher – around 93% in 2011, about 84% in 2018, and around 77% in 2022. Furthermore, these phases usually lasted twelve months or longer, making the current correction appear comparatively mild and short so far.
Should the ongoing crypto winter develop similarly to previous cycles, another downward wave and a longer bottoming phase would still be expected. In 2022, for instance, a low was marked in mid-June at 17,593 USD, but the final, slightly lower bottom at 15,479 USD did not follow until five months later. Accordingly, the current correction is likely to extend somewhat further in terms of time, while the largest price decline is presumably already behind us. The final low point could therefore even lie in the range between 50,000 and 60,000 USD.
From a chart analysis perspective, Bitcoin would thus continue to trend within the upward channel established since late 2022 – a promising signal in the bigger picture. Additionally, the weekly stochastic is clearly in oversold territory. However, the momentum oscillator has shown no signs of a sustainable recovery so far.
The wave structure of the correction and the sideways movement persisting for two months suggest the possibility of a final downward wave in the coming weeks or months. Before that, however, Bitcoin could still initiate a technical counter-movement. So far, all recovery attempts over the past four months have quickly ended in renewed weakness.
In summary, the weekly chart currently remains bearish to neutral. There are no clear signals yet indicating an imminent major recovery – though such an increase is not ruled out. Should a counter-movement begin, there would be potential from a technical perspective to reach the range of approximately 80,000 to 85,000 USD.
Regardless of possible intermediate recoveries, we continue to assume that Bitcoin has not yet reached its final low. This is more likely to form in late summer or early autumn and will probably lie in the range between 50,000 and 60,000 USD.
2.2 Daily Chart: Bitcoin Before the Next Recovery Attempt
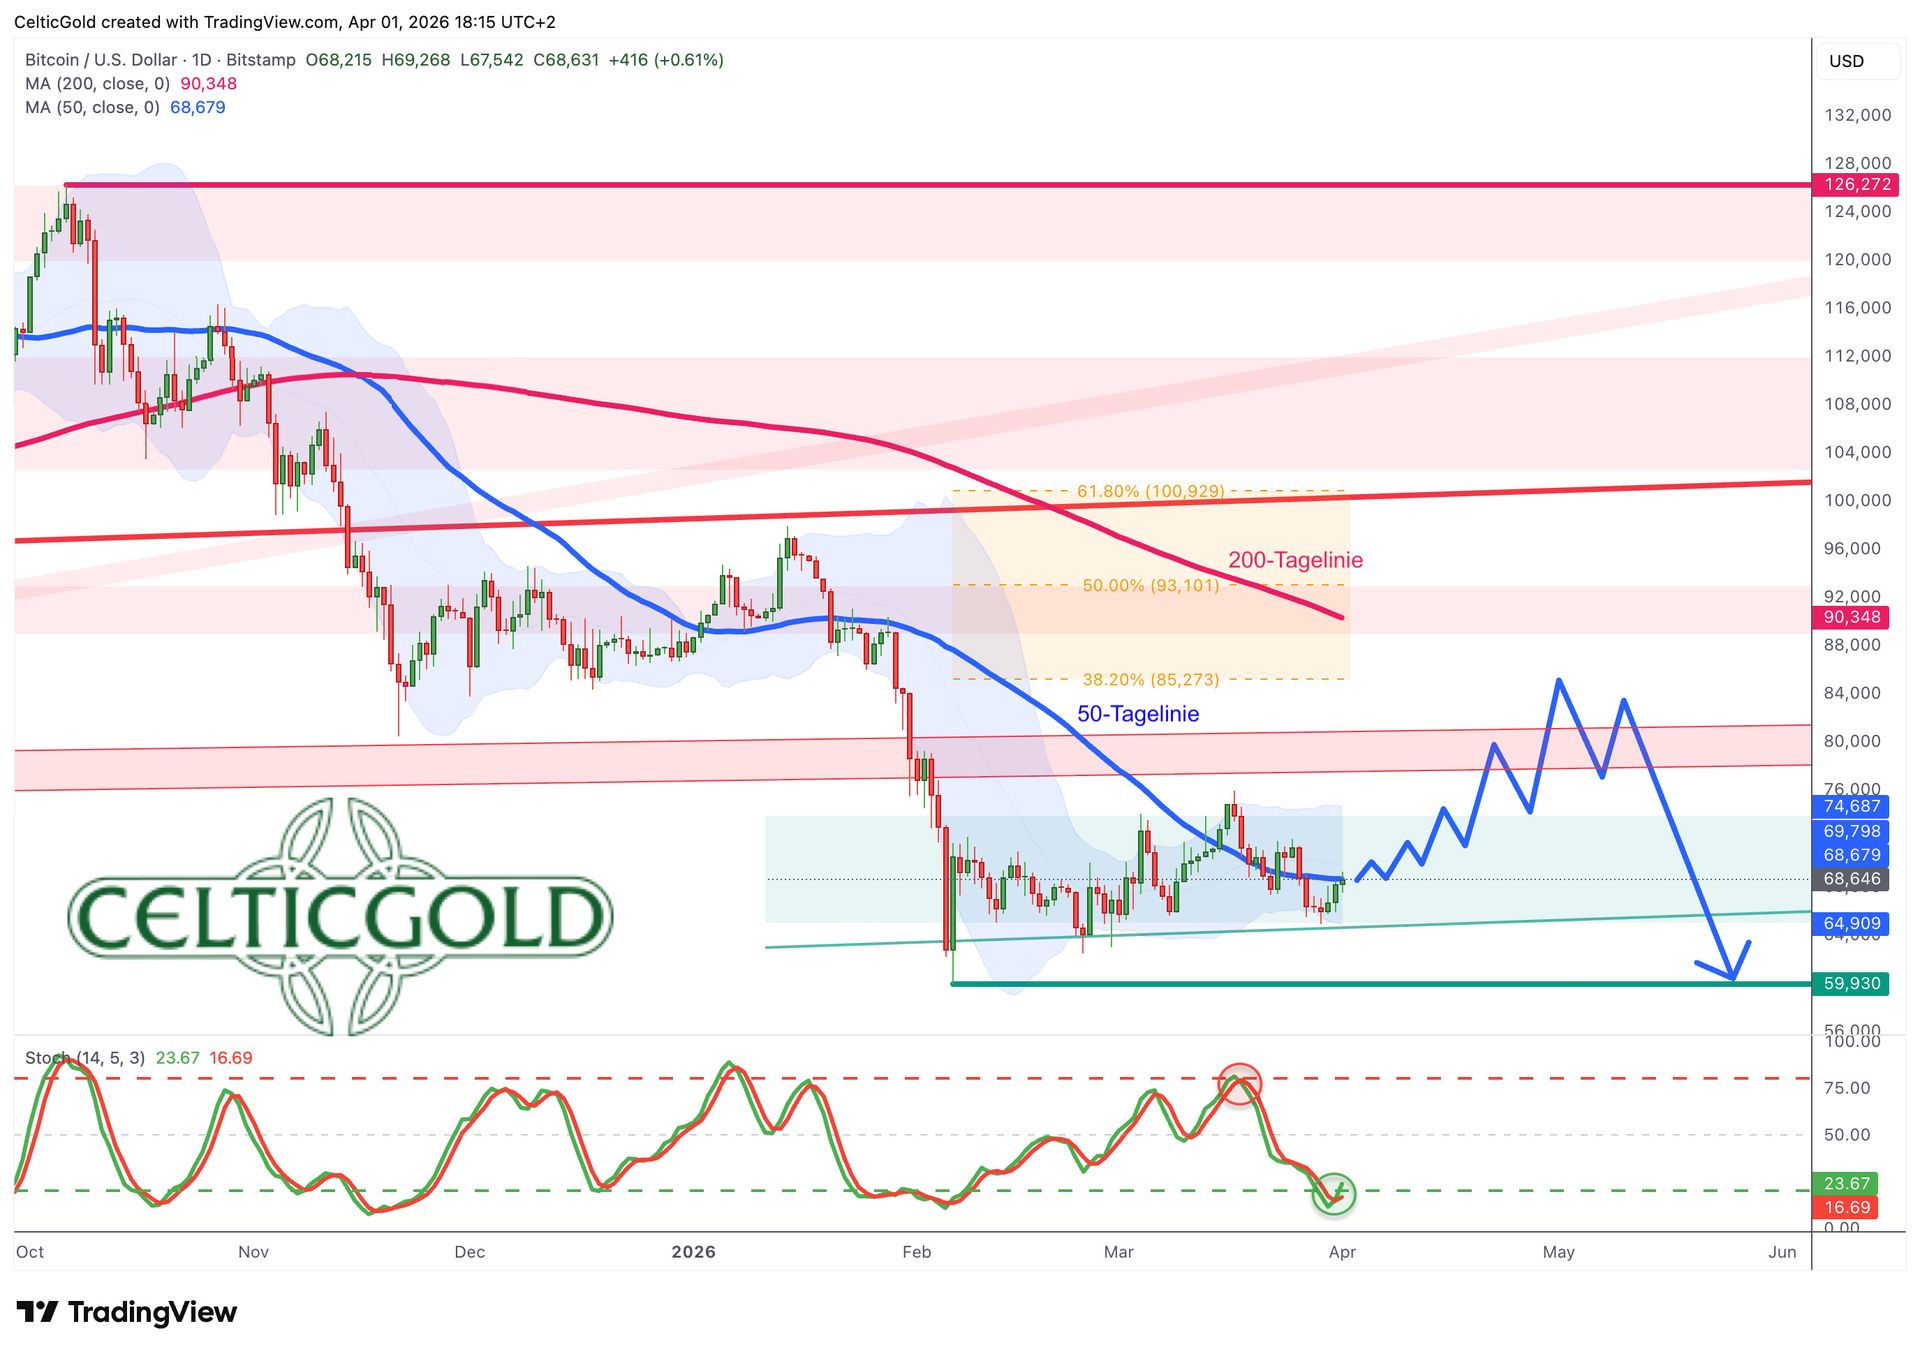
Bitcoin in USD, daily chart from April 1, 2026. Source: Tradingview
On the daily chart, Bitcoin has been moving sideways unspectacularly for two months. The last setback from 76,013 USD down to 64,955 USD has resulted in an oversold stochastic, bringing the chance of a further recovery attempt onto the chart. Currently, the bulls are striving to at least reclaim the 50-day line (68,678 USD). The next hurdle then awaits in the form of the upper Bollinger Band (74,687 USD). If Bitcoin can overcome both resistances, a recovery to the rapidly falling 200-day line (90,348 USD) would be possible and typical.
On the daily chart, Bitcoin has been moving in an unspectacular sideways phase for around two months. The recent geopolitically induced setback from 76,013 USD to 64,955 USD pushed the market into the oversold range of the stochastic, opening up the chance for another recovery attempt. Currently, the bulls are trying to reclaim the 50-day line (68,678 USD). The next hurdle awaits at the upper Bollinger Band (74,687 USD). If Bitcoin succeeds in overcoming both resistances, a recovery to the rapidly falling 200-day line at 90,348 USD would be possible – and quite typical from a chart perspective.
Overall, a new recovery attempt is emerging on the daily chart. Although Bitcoin faces numerous resistances, a major counter-movement to the losses of the past four months is long overdue. On the downside, it is essential to defend the support zone between 66,000 USD and 60,000 USD – otherwise, a further price slide threatens.
3. Bitcoin Sentiment – Capitulation
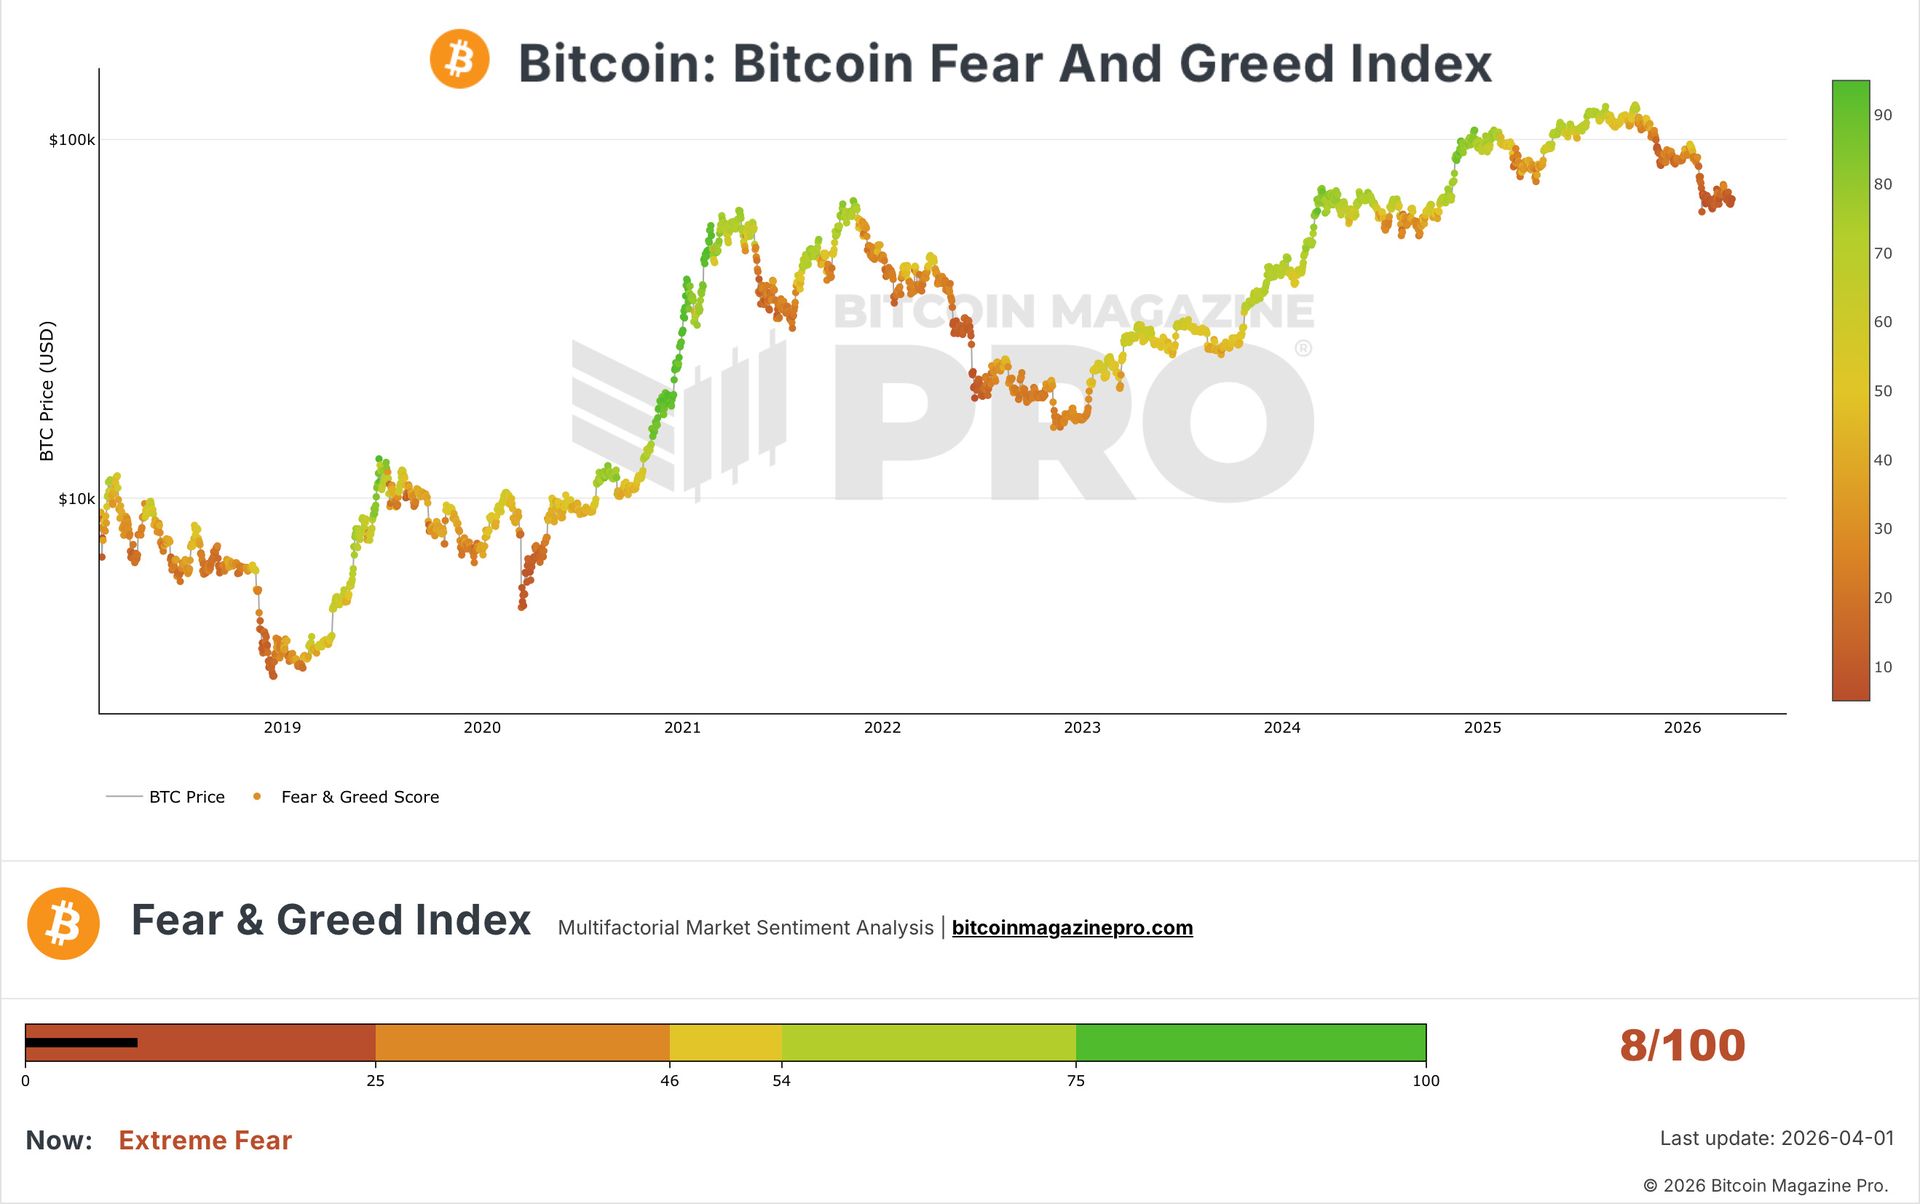
Crypto Fear & Greed Index from April 1, 2026. Source: Bitcoin Magazine Pro.
The “Crypto Fear & Greed Index” is currently at only 8 out of 100 points, reflecting the pronounced mood of surrender in the crypto sector. For contrarian investors, such extreme values are an important indicator of a possible counter-movement. Even if we continue to expect new lows in the overall trend, the chances for a recovery movement are currently good, as no one trusts Bitcoin at the moment!
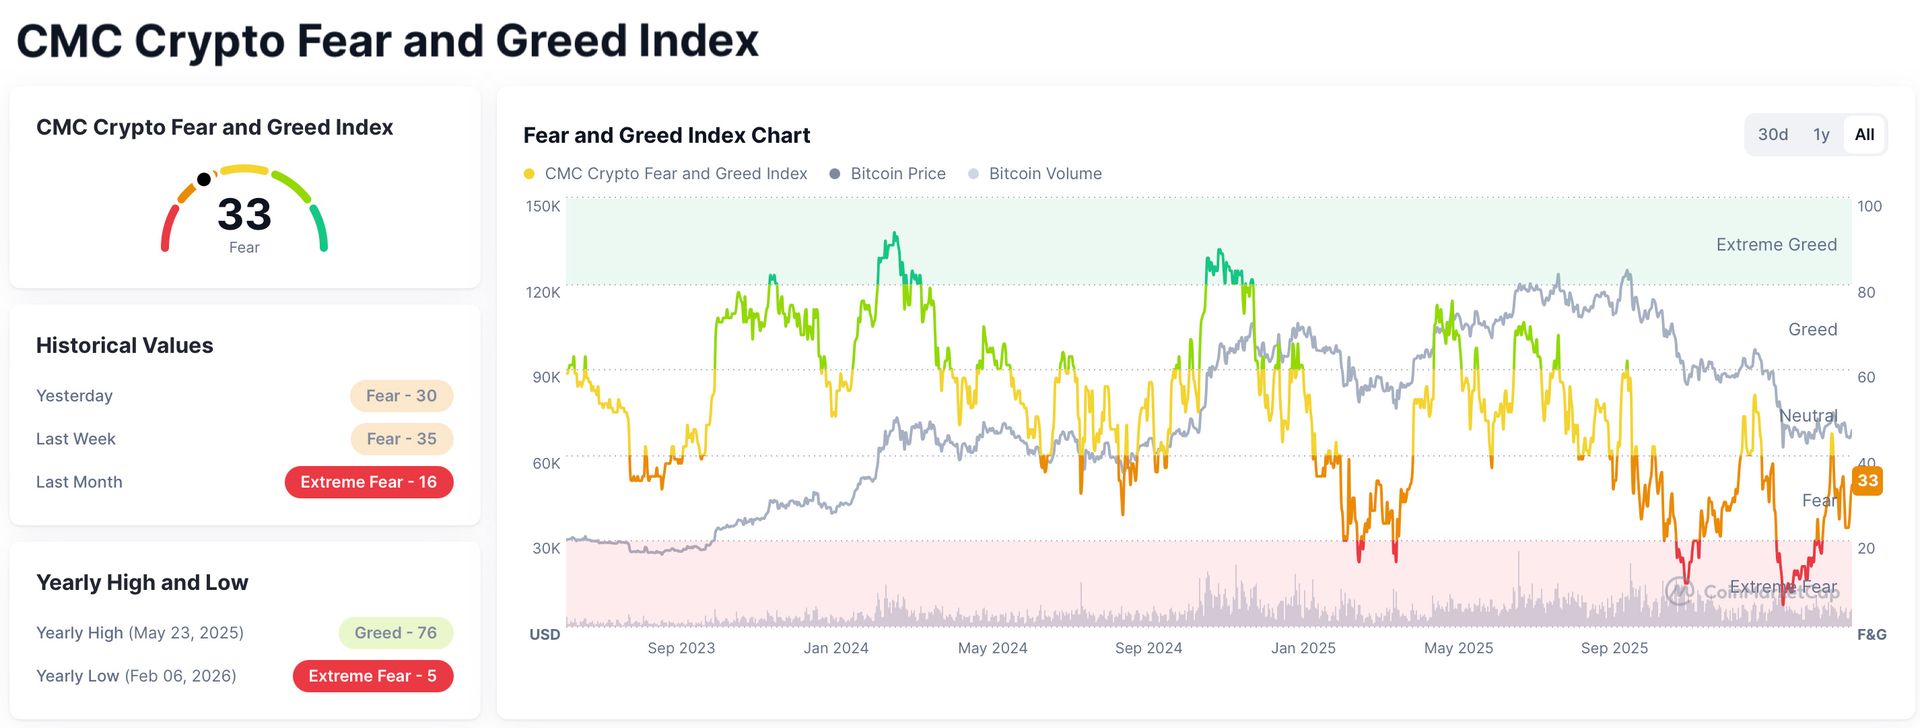
CMC Crypto Fear & Greed Index from April 1, 2026. Source: Coinmarketcap
The “CMC Crypto Fear & Greed Index” from CoinMarketCap, which tracks the broader crypto market (including top 10 coins and stablecoin dynamics), currently stands at 33 out of 100, confirming the prevailing pessimism overall. However, this cannot be considered an extreme value at this time. Rather, the analyzed indicators such as market volatility, momentum, social media activity, surveys, and Bitcoin trends collectively point to a continuation of the consolidation.
In summary, the sentiment analysis signals an impending recovery phase.
4. Bitcoin Seasonality – Recovery Until Early Summer
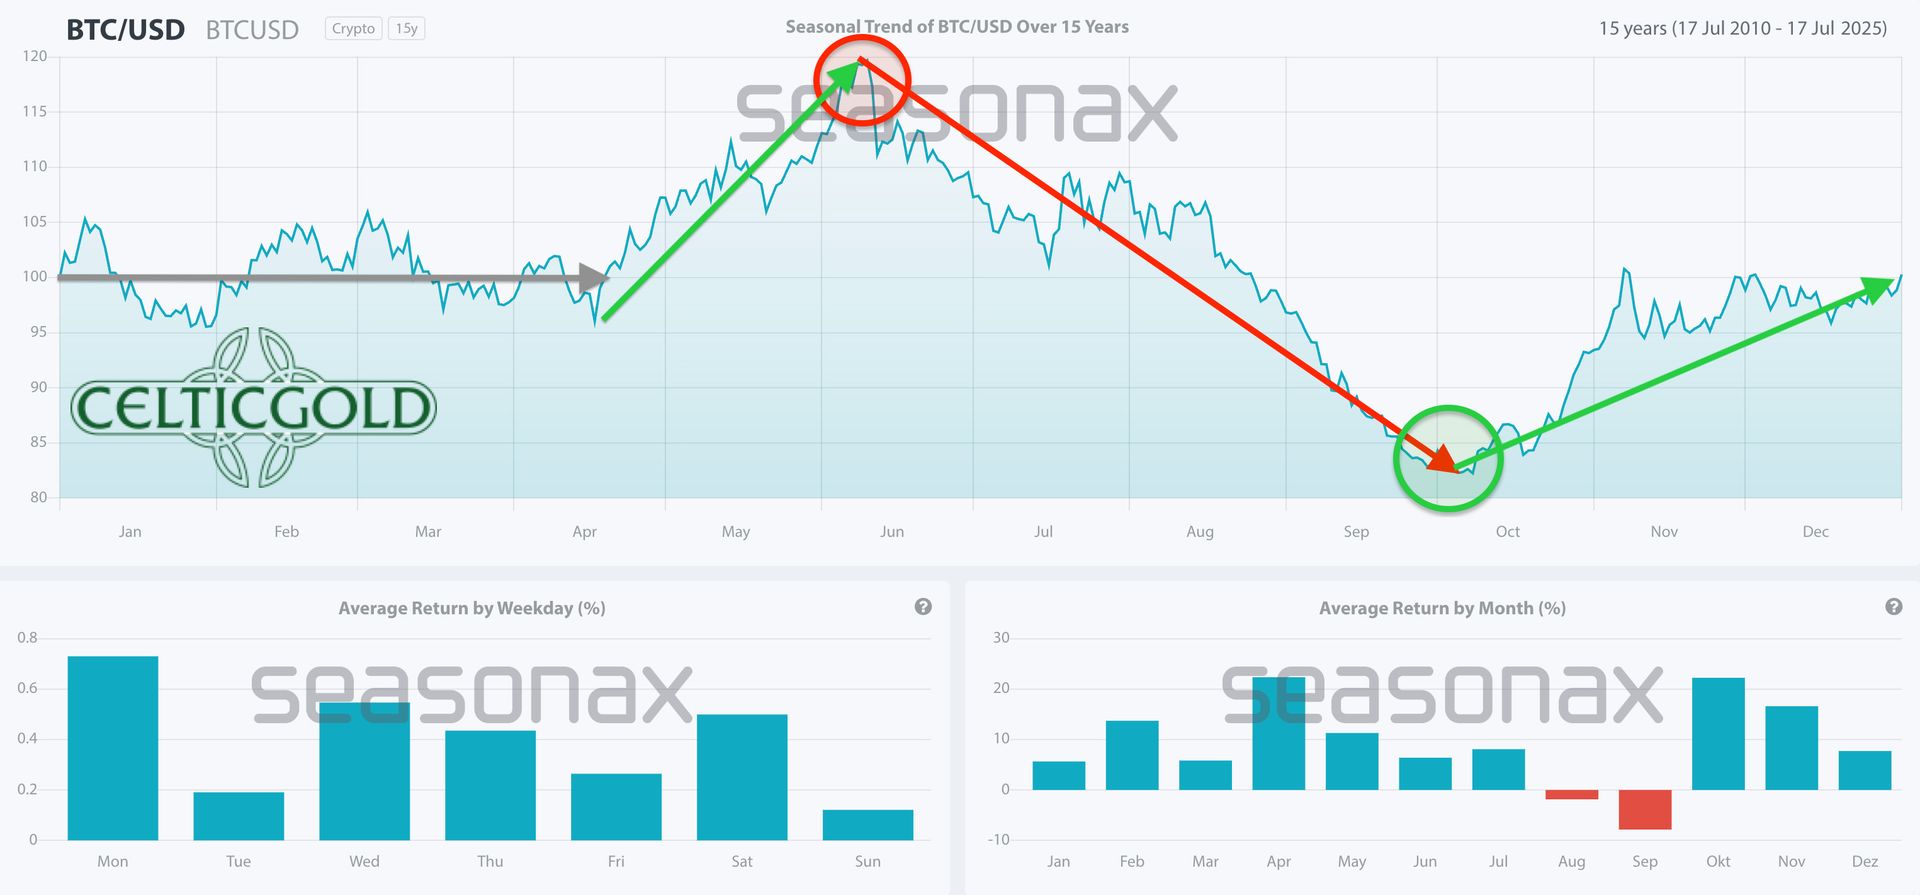
Bitcoin Seasonality from April 1, 2026. Source: Seasonax
While Bitcoin has adhered perfectly to the sideways seasonal pattern over the past two months, this pattern, established over 15 years, changes starting in mid-April. Typically, Bitcoin is expected to rise until June. In the current context, seasonality provides another argument for the recovery we anticipate.
In conclusion, seasonality will shortly shift to bullish!
5. Bitcoin against Gold (Bitcoin/Gold Ratio)
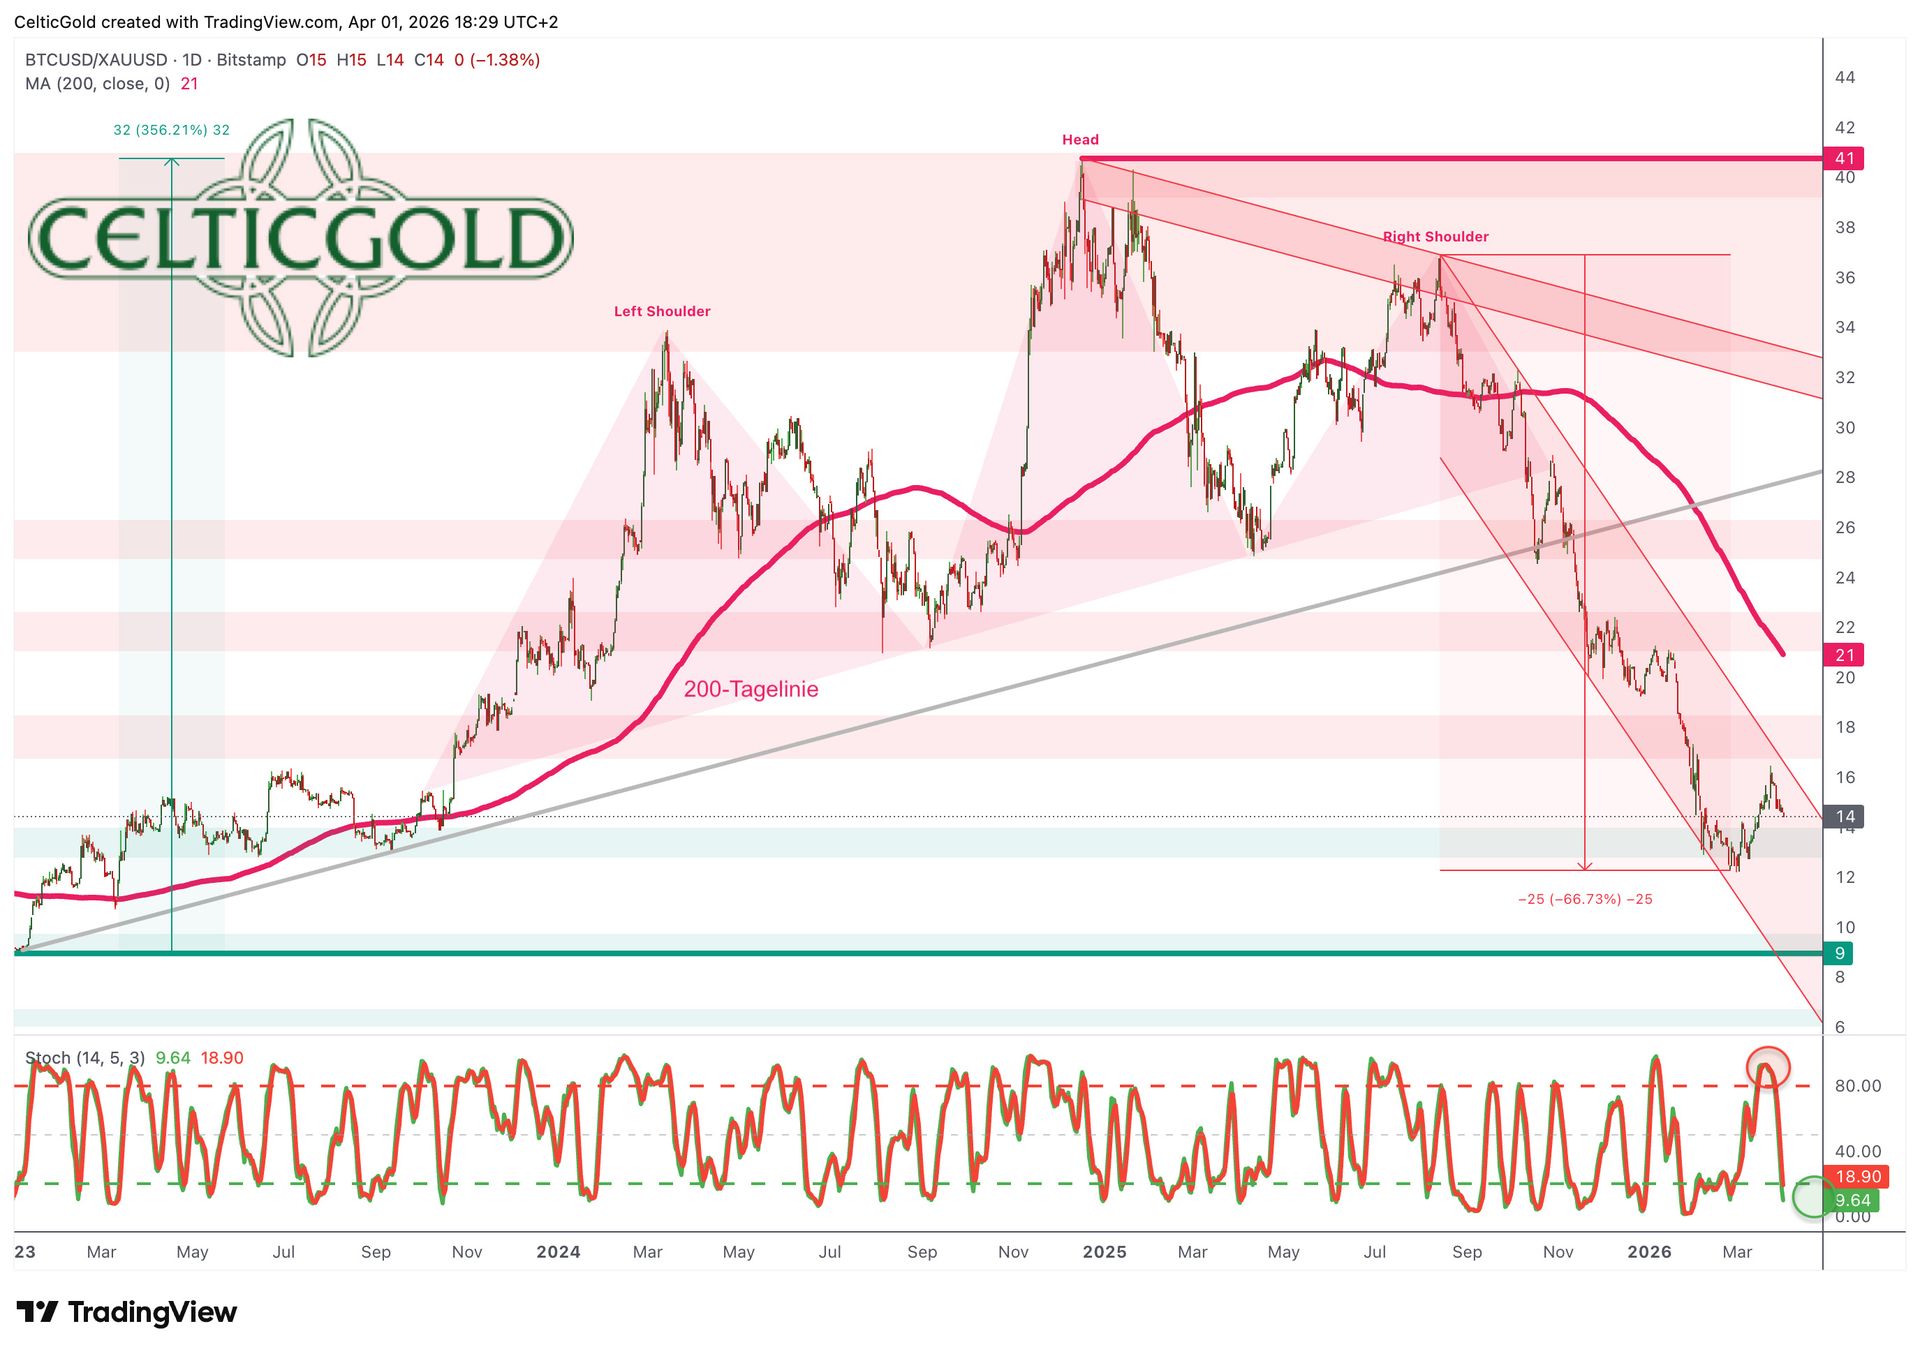
Bitcoin/Gold Ratio, weekly chart from April 1, 2026. Source: Tradingview
With a price of around 68,300 USD per Bitcoin and approximately 4,720 USD per troy ounce of gold, one Bitcoin currently costs around 14.5 ounces of gold. Conversely, the price of one troy ounce of gold currently corresponds to about 0.069 Bitcoin. In March, Bitcoin was able to recover slightly against gold after the ratio had previously collapsed from 37 to 12. However, this development is less due to Bitcoin’s strength and more to the weaker gold price.
As long as the crypto winter persists and the gold bull market continues simultaneously, the Bitcoin/Gold ratio is likely to decline further overall. From a chart perspective, no clear trend reversal is recognizable yet, even though an initial recovery attempt in favor of Bitcoin has been confirmed. In the medium term, we see price targets in the range of a ratio of about 10, while an intermediate counter-movement could have potential up to approximately 18.
In summary, the Bitcoin/Gold ratio points toward a counter-movement or recovery. In the course of a major Bitcoin recovery, ratio values up to about 18 would be quite achievable.
6. Between Oil War, Quantum Threat, and Monetary Turning Point
The US President contradicts himself. Source: Daractenus
The war in Iran has kept the world in suspense for four and a half weeks. The blockade of the Strait of Hormuz triggered a new inflation shock and sent financial markets into a four-week tailspin. The DAX lost 14%, and gold fell by over 24%, while the price of oil exploded. Bitcoin, on the other hand, showed some recovery in the meantime, as expats in Dubai used the cryptocurrency to transfer capital out of the Emirates. Ultimately, however, the price fell back to the pre-war level of around 65,500 US dollars.
Interest Rate Turnaround as an Accelerator – Debt Avalanche and Real Interest Rate Shock
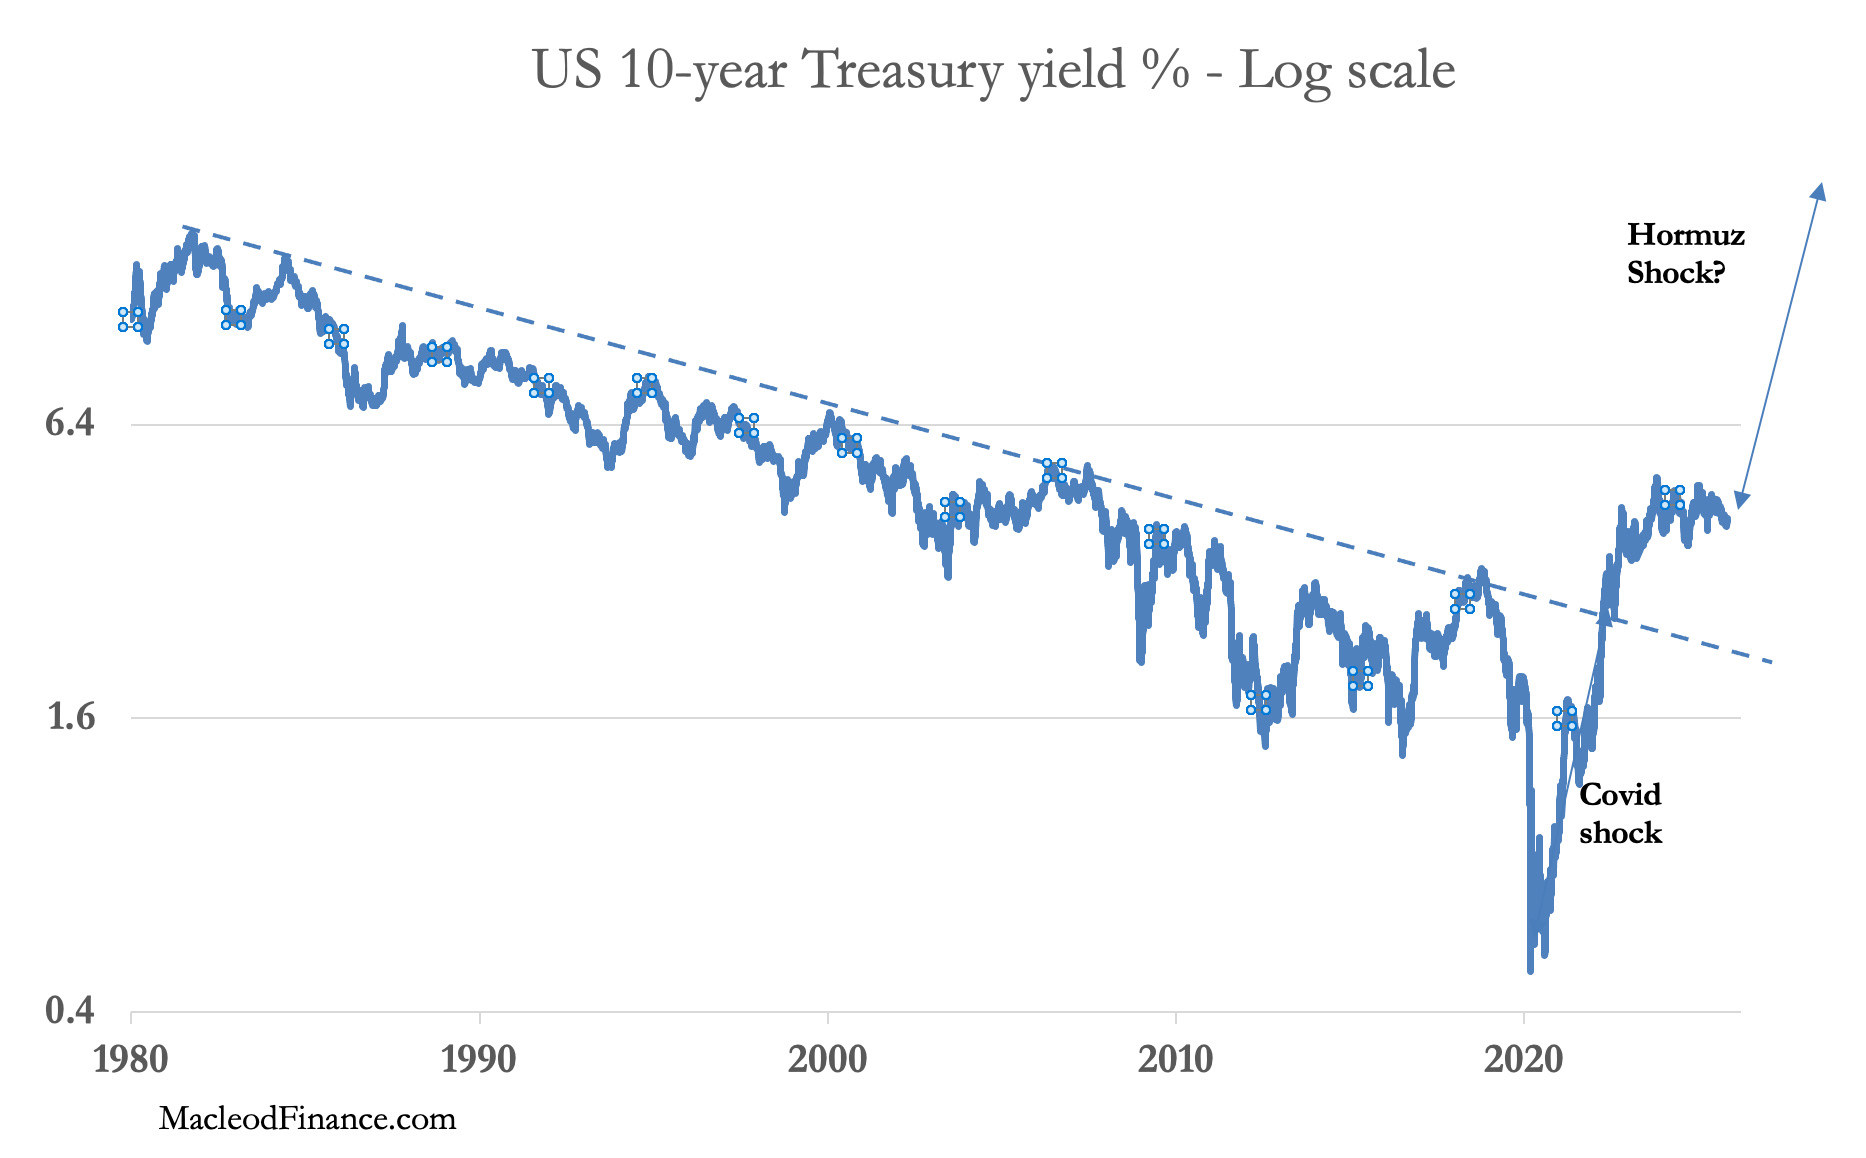
US Treasury yields, from March 30, 2026. Source: Alasdair Macleod
At the same time, yields on almost all G7 government bonds shot upward. Rising financing costs and growing budget deficits are bringing the danger of a global debt trap to the center of investor attention. With the ten-year US Treasury at 4.32%, signs are mounting that the critical turning point is approaching. The global bond and currency markets appear like a cartoon character that has long since run past the edge of the abyss – the feet are still rotating, but the fall has already begun. It is becoming increasingly clear: debt avalanches, real interest rate shocks, and geopolitical escalations are not passing macro-weather, but tectonic shifts in the global economy.
While Donald Trump and the USA invoke stability, the Middle East speaks a different language. Iran’s asymmetric warfare was completely underestimated. The
political damage is already enormous and could even lead to the end of the US petrodollar in the medium term. Not to mention the numerous fatalities as well as the significant economic and ecological damage.
The Bottleneck of the Global Economy – Why the Strait of Hormuz is China’s Achilles’ Heel
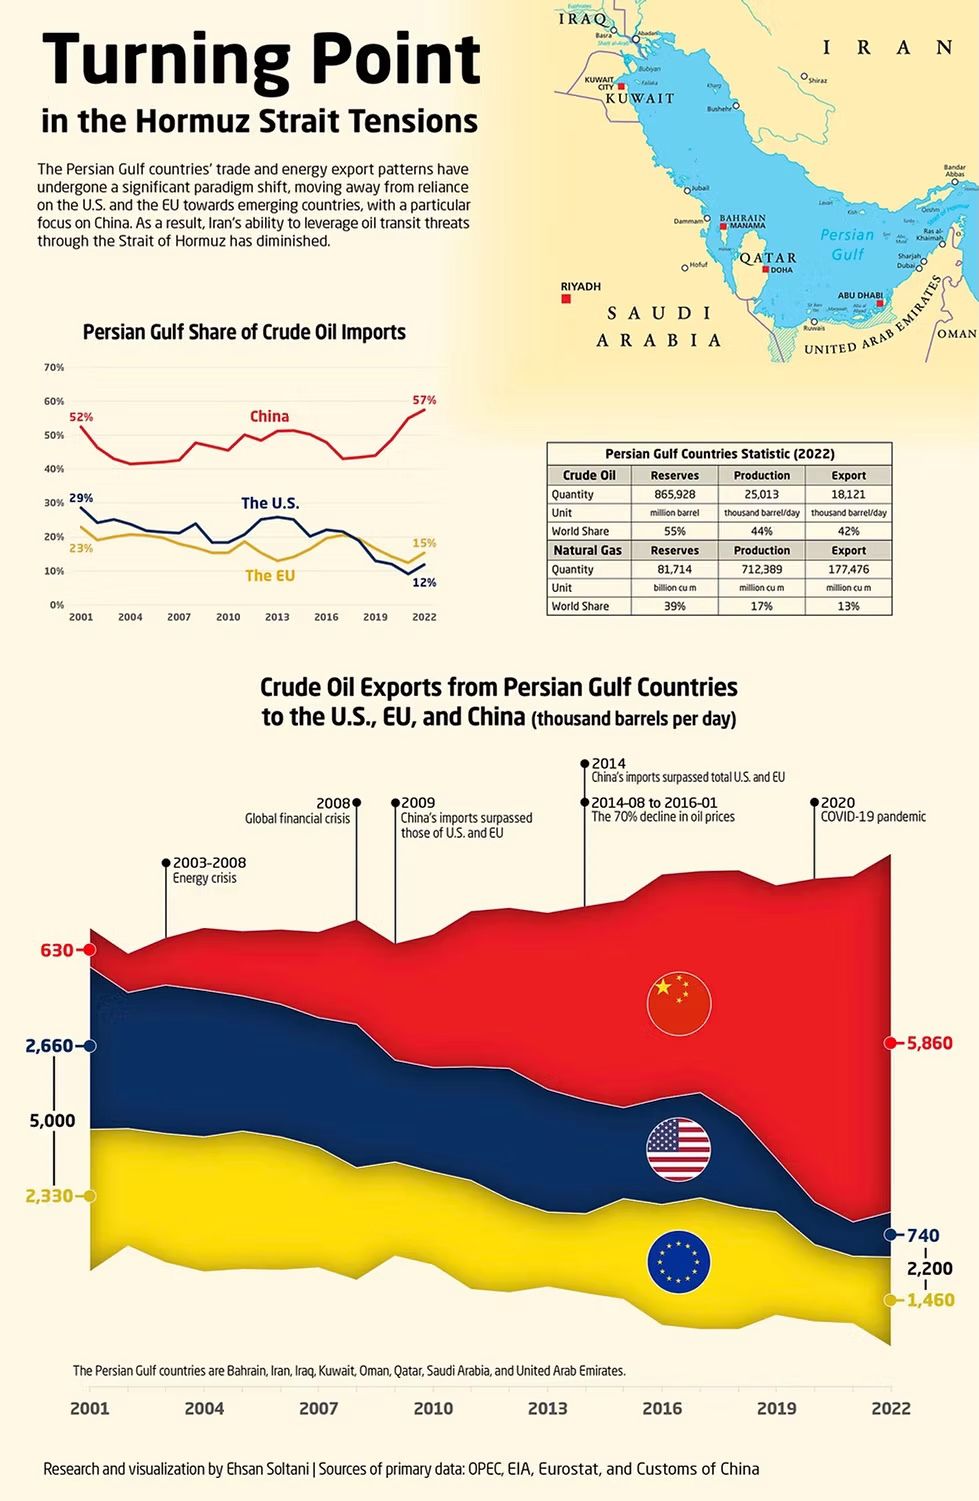
The Strait of Hormuz. Source: Ehsan Soltani
The Strait of Hormuz, located between Oman and Iran, is the world’s most important bottleneck for oil transport, through which around 90% of oil exports from the Persian Gulf and about 20 million barrels per day pass. While Iran long used this strategic location as leverage against Western nations, the global energy landscape has shifted significantly: the USA and the EU are less dependent on oil from the Gulf states today, while China in particular has risen to become the most important buyer, now receiving over 30% of exports.
Overall, the Gulf region possesses around 55% of the world’s oil reserves and remains a central player in the energy market, but trade flows have increasingly shifted toward Asia. This development weakens Iran’s geopolitical leverage over the West, but simultaneously increases China’s economic vulnerability to possible disruptions in the Strait of Hormuz.
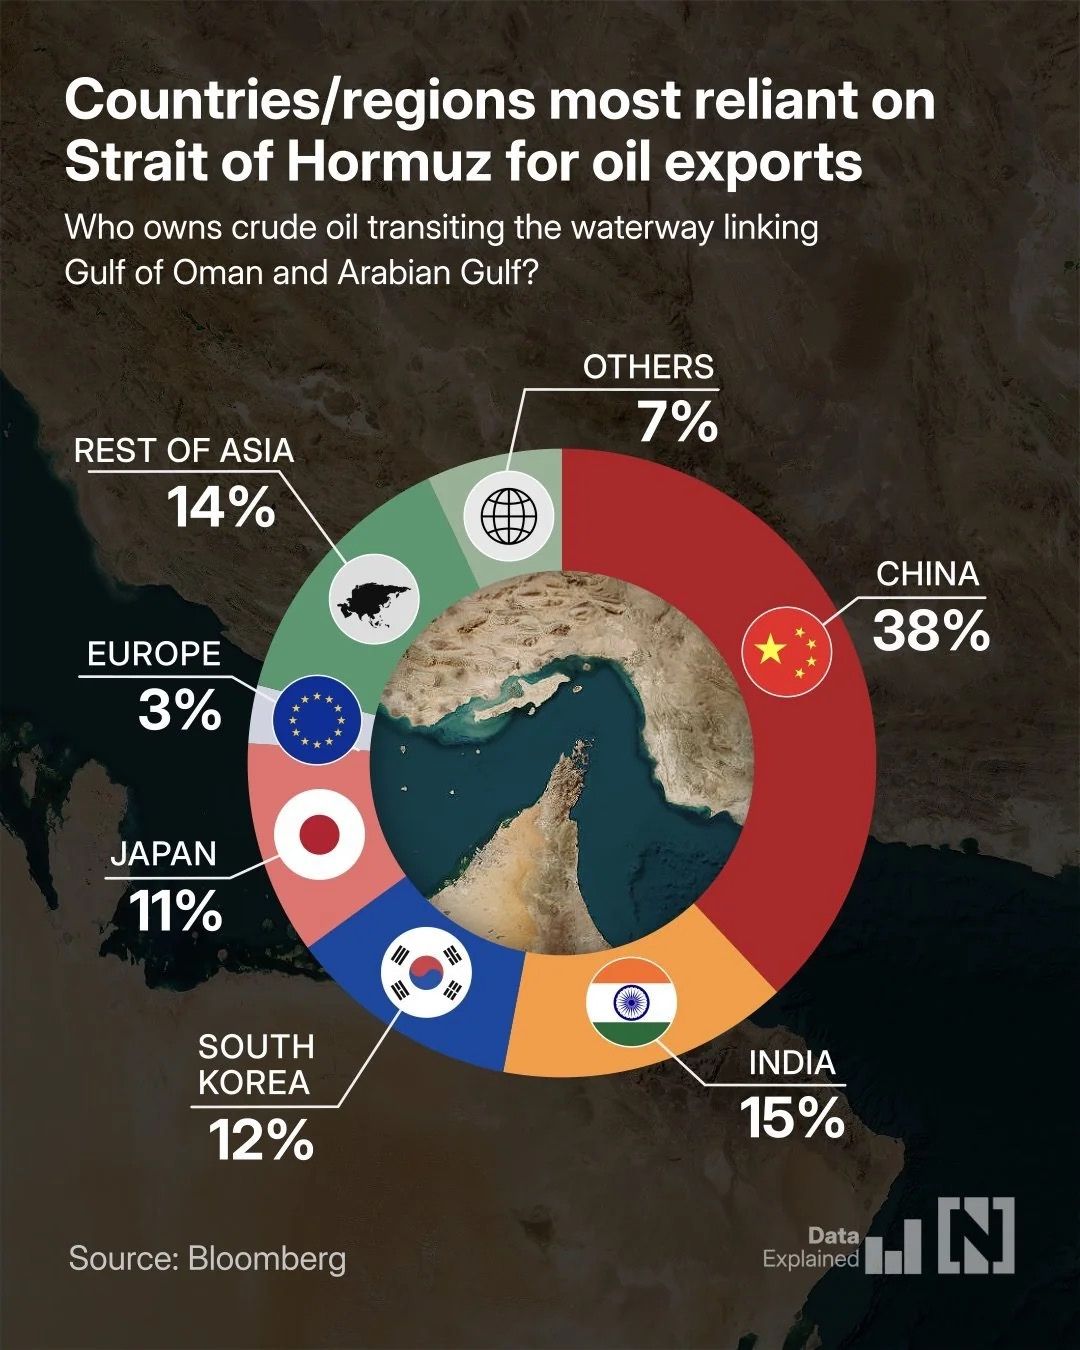
Countries with the greatest dependence on the Strait of Hormuz. Source: Bloomberg
With the escalation at the Strait of Hormuz, energy-dependent states such as Japan have already lost their economic balance. The ongoing tensions could trigger a worldwide energy crisis. Some regions are already suffering from power outages, four-day weeks, and rapidly rising prices for food and groceries. The energy crisis resulting from the Iran war hits the poorest first. In this environment, fiat money is no longer a stable haven, but merely a political promise – and promises only hold as long as they are believed.
Energy Policy as a Global Chessboard
Despite massive supply disruptions, the oil price – both nominal and inflation-adjusted – is still significantly below the levels of previous crises. The fact that it has not exploded more strongly so far is due not only to price management on the futures markets but also to the enormous inventories in the Gulf states and the production capacities expanded before the outbreak of war, as well as, of course, the energy independence of the USA. The latter has developed into a global energy dominator after decades of import dependence thanks to fracking, while Europe and especially Asia remain structurally vulnerable.
Furthermore, it is important to understand that precious metals are no longer the only assets traded at different prices in the East than in the West – the same now applies to oil and rare earths. Accordingly, the geopolitical risk premium is driving energy prices worldwide and fueling new inflation fears. In response, the Federal Reserve has significantly scaled back its interest rate cut expectations.
The close correlation between cryptocurrencies and US stock indices is confirmed once again. Nevertheless, Bitcoin is showing remarkable resilience in the recent risk-off phase. While the world staggers through a geopolitical and economic state of emergency in the first quarter of 2026, Bitcoin presents itself not as an object of speculation, but as a precise real-time barometer of global upheavals.
Quantum Computers – The New Apocalypse of Cryptography
At the same time, Google’s warning that future quantum computers could crack current cryptographic methods protecting Bitcoin and other digital assets with significantly fewer resources than previously assumed casts a shadow over the entire crypto sector. Although such computers do not yet exist, according to a new study, the computing power required to break elliptic-curve cryptography (ECDLP-256) could be around twenty times lower than previously thought. Since this technology is used in large parts of the crypto market to secure transactions and wallets, researchers urged a rapid transition to so-called post-quantum cryptography (PQC), which is intended to withstand attacks by quantum computers.
Google emphasized that the paper was a preventive warning, not a prediction of an imminent collapse. The company itself intends to fully transition its systems to PQC by 2029. Experts see the study as a wake-up call for “responsible haste”: while there is likely enough time to make blockchains more secure, the window of opportunity is shrinking rapidly. Initial projects such as QRL, Abelian, and Algorand are already experimenting with quantum-secure methods, which researchers say shows that the transition is technically feasible and urgently required. The lead toward a secure future is shrinking fast. Bitcoin, Ethereum & Co. face a race against time – the transition to post-quantum cryptography (PQC) will likely become the next hard fork of trust. Those who act now may form the backbone of post-classical money; those who hesitate will be dethroned.
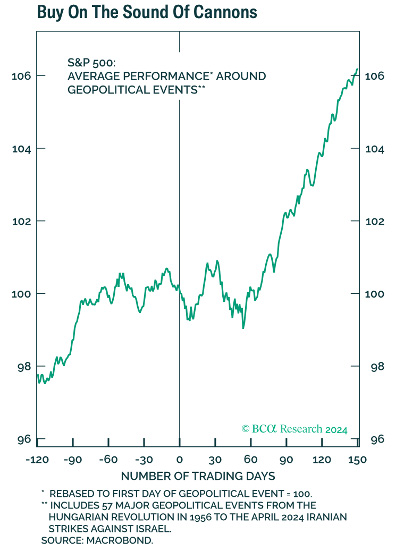
Buy when the cannons roar. Source: BCA Research 2024
“The market does not turn when it sees light at the end of the tunnel. It turns when everything appears black – just a barely perceptible shade lighter than the day before.” – Jeremy Grantham
Overall, financial markets remain in crisis mode, even though a notable recovery in stock and precious metal prices has been evident for three days. The escalation between the USA, Israel, and Iran causes capital flows to oscillate cyclically between “risk off” and “relief rally.” 2026 will not be a year of euphoria, but one of disillusionment – a year in which actors in markets, governments, and societies are confronted with the gap between reality and rhetoric. In this discrepancy, it will be decided who learns from the crisis – and who merely manages it.
Bitcoin as a Mirror of the Age
Bitcoin exists exactly in this gap – as an asset for those who accept that stability is not a natural constant. Perhaps the greatest paradox is: the more unstable the world becomes, the more stable an algorithm with a fixed limit of 21 million appears. In any case, after six months of hard correction, a certain strategic sobriety is slowly returning. Balance sheet management replaces meme culture; debt consolidation instead of yield strategies and hedging derivatives. Bitcoin is transforming from an asset of revolt into a tool of capital structure – that quiet revolution that marks the difference between speculative euphoria and financial architecture. However, Bitcoin must solve its governance and security problems, otherwise Bitcoin will be a brilliant but self-destructive experiment.
7. Conclusion: Bitcoin – Recovery Until Early Summer
Despite or perhaps because of the global crisis, Bitcoin is currently at an interesting turning point: on the one hand, the heavily oversold market situation, high pessimism, and typical seasonality from mid-April, along with the foreseeable expansion of the money supply given the dramatic debt explosion, argue for a noticeable recovery until early summer. On the other hand, the overall correction process remains intact as long as Bitcoin does not sustainably overcome key resistances and the final low in the current crypto winter is still outstanding. Furthermore, a single tweet from US President Trump is currently enough to send markets heading south again.
As long as the situation in the Middle East does not escalate completely, we see good overall chances for a recovery toward 75,000 USD to 80,000 USD, perhaps even 85,000 USD. This should then be followed by the final sell-off in this crypto winter.
Florian Grummes
Precious Metals and Crypto Expert
www.midastouch-consulting.com
Source: www.celticgold.de


