

1. Review
For over four months, the gold price consolidated sideways at a high level since the end of April. The spectacular rally since the beginning of the year initially concluded on April 22 with a new all-time high of $3,500, leading to a sharp but brief pullback to $3,120. Subsequently, the bulls achieved a notable recovery, yet all attempts to break above the resistance zone between $3,400 and $3,450 failed in the ensuing months. Concurrently, the bears made little headway on the downside.
Accordingly, from late spring into mid-summer, prices largely fluctuated within a range of $3,200 and $3,400. In August, this trading range narrowed progressively before another pullback to $3,311 occurred.
From this low point – and particularly since the central bankers’ meeting in Jackson Hole – the gold price embarked on a new upward trajectory. The breakout from the multi-month consolidation triangle unleashed pent-up energy, driving gold prices to new all-time highs almost daily for the past four weeks. With the new peak of $3,791, the gold price has surged by almost 44.5% on a US dollar basis since the beginning of the year. In euro terms, the performance is slightly weaker at 27.7%.
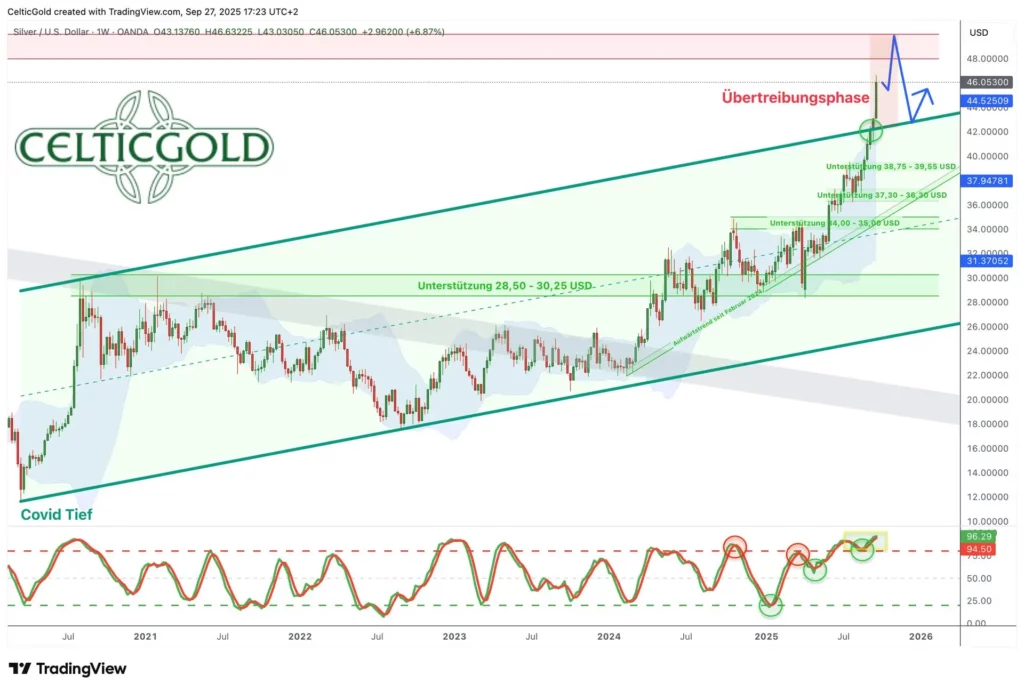
Silver in US dollars, weekly chart as of September 27, 2025. Source: Tradingview
The silver price has also risen significantly in recent weeks, notably overcoming the crucial hurdle around the $40 mark. Prices above $40 were last observed 14 years ago, in August 2011!
Previously, silver primarily benefited from the strong rise in the gold price and showed little independence. However, with the breakout above the psychologically significant $40 mark and the rise above $46, the silver price has become independent and is now likely aiming to reach the all-time high around $50 as soon as possible.
Around this all-time high, a short-term top in precious metals would also be anticipated, as gold, silver, and mining stocks now appear significantly overbought after the spectacular upward movement of recent weeks and could benefit from a pause.
2. Chart Analysis Gold in US Dollars
2.1 Weekly Chart: Next Price Target at $4,000 Still in October or Only in Spring 2026?

Gold in US dollars, weekly chart as of September 27, 2025. Source: Tradingview
With the breakout from the four-month consolidation triangle, the gold price has ushered in the next phase of its secular bull market. The force and speed of the recent price increase are undoubtedly impressive, leaving no doubt that the bulls are currently clearly dominating the market.
On larger timeframes, such as weekly and monthly charts, the situation appears significantly overbought – yet this is precisely typical for pronounced bull markets, where surprises usually occur on the upside.
It is particularly noteworthy that the weekly stochastic has shifted into a bullish embedded status, firmly anchoring the uptrend on a weekly basis. Concurrently, the gold price is now clearly trading above its weekly Bollinger Band ($3,693). This significantly increases the risk of surprising and sharp pullbacks. However, there are still no sell signals – the uptrend appears to be running “like clockwork”.
After the first price target from the consolidation triangle at $3,750 has already been reached, the psychologically highly significant $4,000 mark is now slowly but surely coming into focus.
Overall, the weekly chart appears clearly bullish. The sustained strong upward momentum could potentially lead the gold price to the round $4,000 mark for the first time very soon. However, price targets significantly above this level appear somewhat too optimistic for the next few months, given the highly overbought situation. Nevertheless, a rise into the $4,300 to $4,400 range is certainly conceivable by spring 2026.
Should the gold price form a peak at or slightly above $3,800 within the next one to three weeks, the ascent to $4,000 will likely be postponed until Q1 2026.
2.2 Daily Chart: Decelerating Momentum
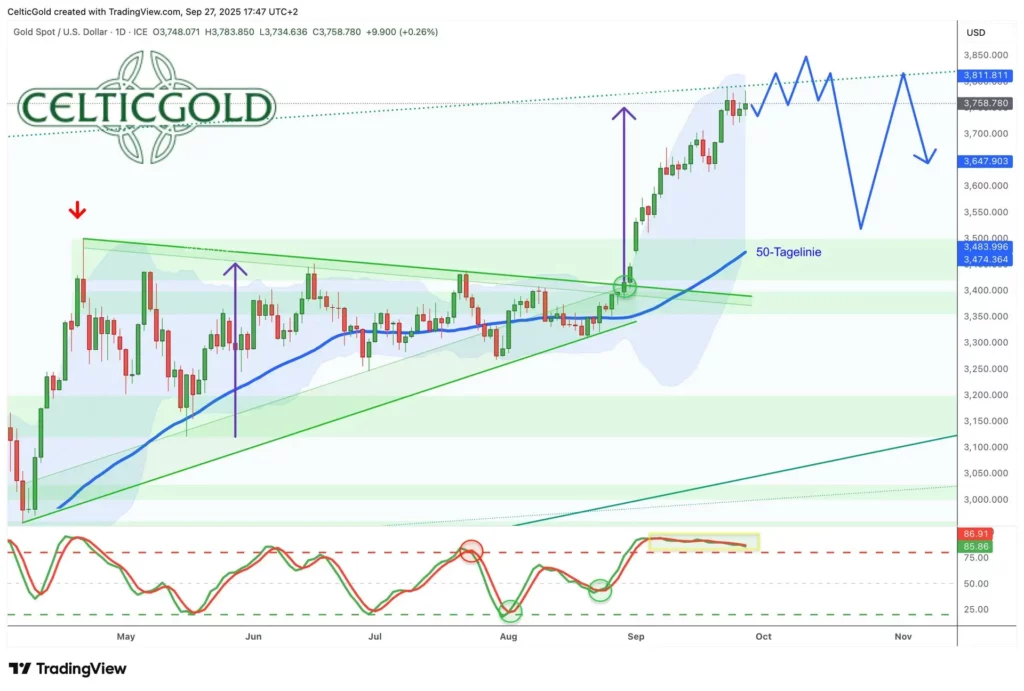
Gold in US dollars, daily chart as of September 27, 2025. Source: Tradingview
On the daily chart, the gold price has surpassed all resistances and is now moving into uncharted territory. Accordingly, clearly defined support and resistance levels are absent. The Bollinger Bands currently span a wide movement corridor with $3,806 on the upside and $3,492 on the downside, while the stochastic oscillator just managed to maintain its bullish embedded state into the weekend. However, after a dynamic start to the week, momentum noticeably decreased over the past three trading days. Reversal signals, however, remain scarce.
The price target derived from the four-month triangle, approximately $3,750, has already been reached. There is still some room until the next major milestone at $4,000. Should the silver price indeed target the $50 mark in the coming days or weeks, the gold price should benefit and follow suit. However, the last two to three trading days have shown that gold alone no longer possesses the necessary momentum.
Overall, the daily chart remains clearly bullish and offers opportunities for an extension of the rally towards $3,800, possibly even up to $3,850. Whether the bulls will also manage to break through towards $4,000 remains to be seen or is questionable. Historically, the strongest phase for stock and crypto markets begins in mid-October. A corresponding capital rotation could therefore soon bring headwinds for the highly overbought precious metal prices.
3. Futures Market Structure Gold
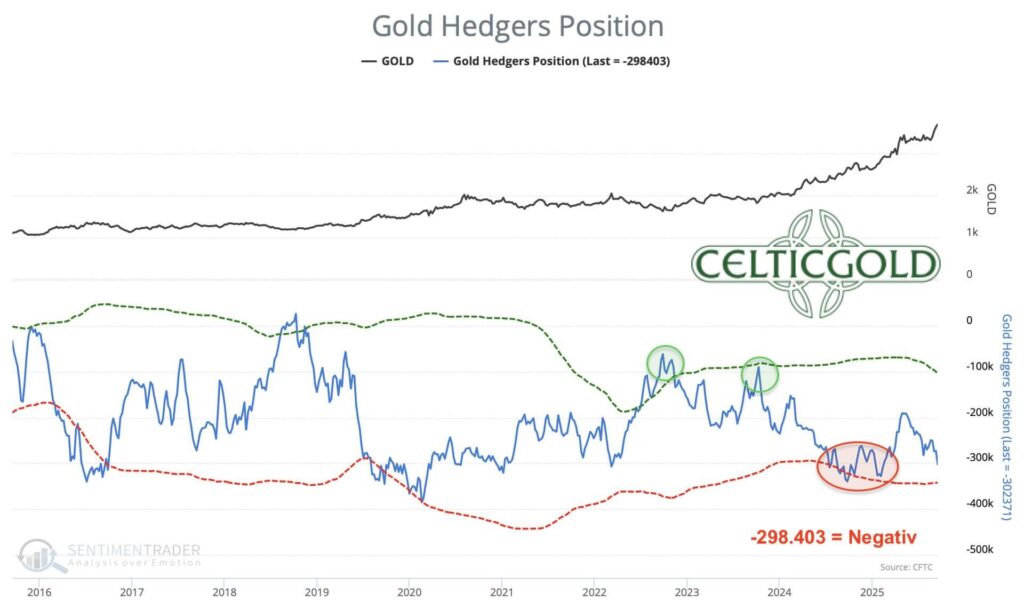
Commitments of Traders Report for Gold Futures as of September 27, 2025. Source: Sentimenttrader
At the closing price of approximately $3,691, commercial traders held a cumulative short position of 298,403 gold futures contracts on Tuesday, September 23. In the wake of the strong gold rally in recent weeks, the commercial net short position has, as expected, expanded significantly again. Even though the current futures market data once again sends a clear warning signal, its significance should neither be overestimated nor ignored. We continue to assume that the “paper gold” jugglers have lost control over the gold market and that physical demand is now primarily determining price formation.
Based on data from the last 25 years, the CoT report provides a strong sell signal.
4. Gold Sentiment

Sentiment Optix for Gold as of September 27, 2025. Source: Sentimenttrader
Due to the steep price gains, the Sentiment Optix indicator for the gold market is currently showing significantly elevated optimism levels again. One can certainly speak of euphoria. Under these circumstances, a contrarian entry opportunity is not present. Rather, the strong price increases are increasingly attracting inexperienced market participants who wish to jump on the fast-moving bandwagon.
While gold has not yet become a ubiquitous topic of conversation in the mainstream, the overheated sentiment will soon require a cooling-off period. Historically, such steep price increases and euphoria highs are followed by at least a multi-week corrective movement or a sharp and deep, shock-like pullback.
Overall, sentiment is in an overly euphoric range and sends a warning signal that investors should by no means ignore.
5. Gold Seasonality
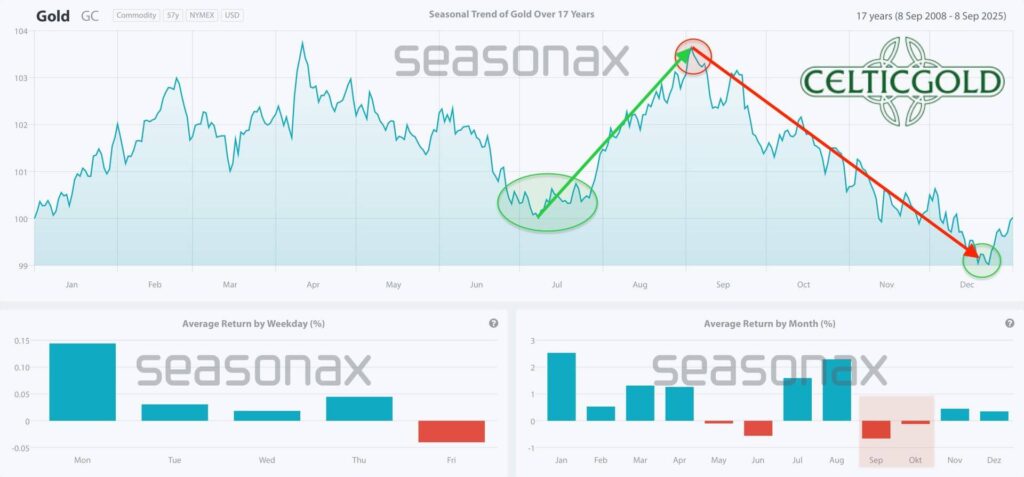
Seasonality for the Gold Price over the Last 17 Years as of September 8, 2025. Source: Seasonax
As often in recent decades, the gold price, after a typical correction or consolidation phase throughout late spring and early summer, marked its cyclical summer lows at the end of July and mid-August. Since then, the gold market has been in a pronounced phase of strength, which historically reaches its peak in September.
However, since the significant high of $3,500 was only formed at the end of April, the cycle has probably shifted slightly later this year. Against this backdrop, a significant interim high is to be expected in the coming weeks – approximately until mid-October, but at the latest by the end of October.
This implies that the gold price likely has only a few more weeks of upside potential at best, before a multi-week corrective phase should begin, which is expected to last until at least mid-December.
Overall, the seasonal traffic light has already turned dark orange, urging caution.
6. Macro Update – The Four Fundamental Drivers for the Gold Price

The steep price increases in the precious metals sector impressively underscore that the gold price is far more than just a technical chart phenomenon. Behind the rally are strong and underlying macroeconomic forces that provide sustainable impetus to the market. Inflation expectations, interest rate policy, global geopolitical uncertainties, and developments in capital and currency markets form central pillars, though only at first glance. Anyone who wants to understand the gold market and assess its long-term dynamics must keep an eye on the true fundamental drivers.
1. Liquidity
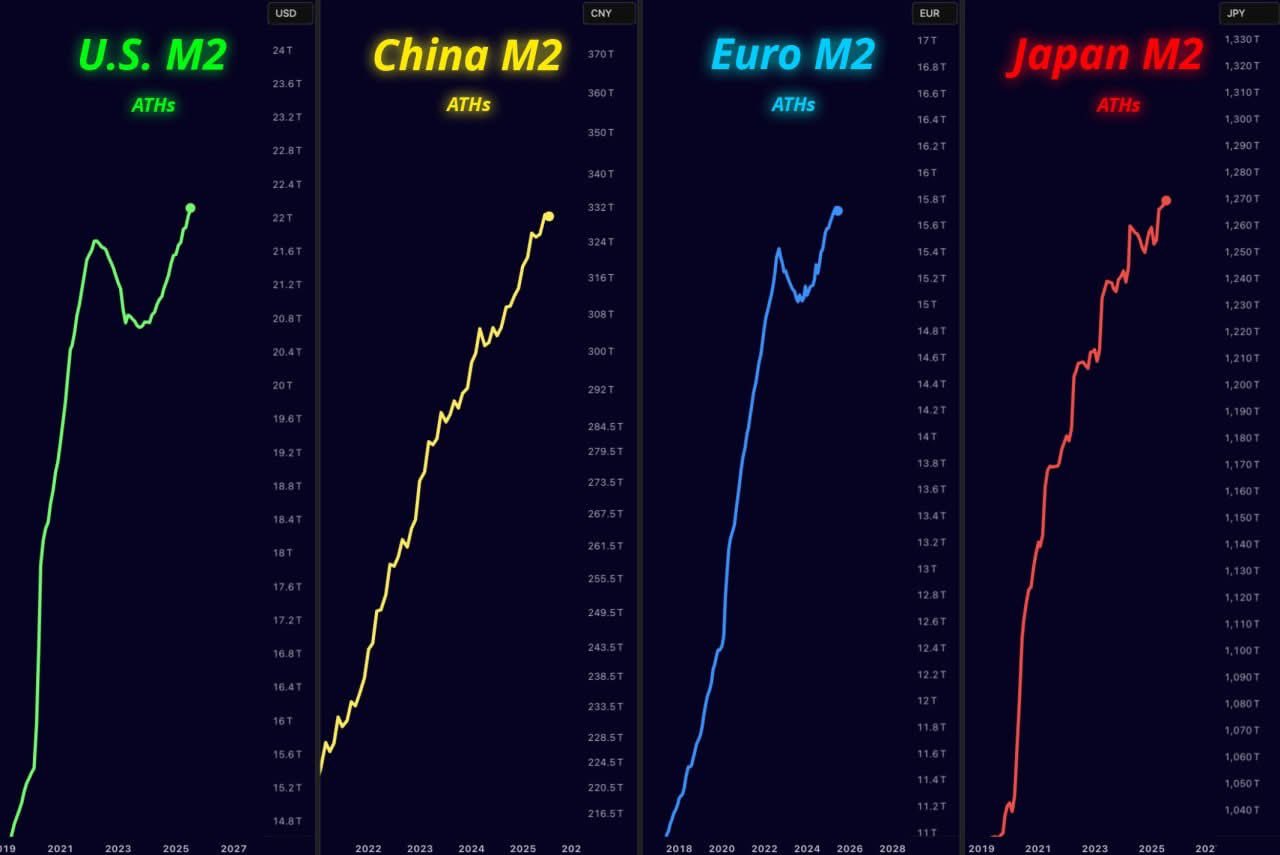
Money Supply Growth in the USA, China, Eurozone, and Japan, as of September 5, 2025. Source: Unknown
One of the most important prerequisites for functioning markets, and especially for rising prices, is global liquidity. Monetary policy easing, expansive fiscal programs, or strong credit impulses create excess capital that seeks investment opportunities.
The extreme expansion of the money supply over the last 25 years is one of the central drivers for the gold price. In the USA alone, the M2 money supply reached a new record high of $21.9 trillion in May 2025. Since the end of 2023, it has increased by another $1.36 trillion – a considerable rise in a very short time.
Globally, the money supply has grown by $73.74 trillion since 2007, an increase of almost 200%. This massive flood of liquidity has noticeably eroded the value of the US dollar: over the past twelve years, it has lost more than half of its purchasing power. Precisely this creeping loss of purchasing power makes gold increasingly attractive as a reliable store of value for investors worldwide. In the search for safe or inflation-protected investments, gold benefits twofold in such phases: on the one hand, through declining opportunity costs compared to interest-bearing assets, and on the other hand, through increasing demand for real stores of value. However, the unrestrained expansion of global money supplies also naturally drives up stock indices, real estate, cryptocurrencies, and other tangible assets, as well as all living costs.
2. Bear Market in Bonds
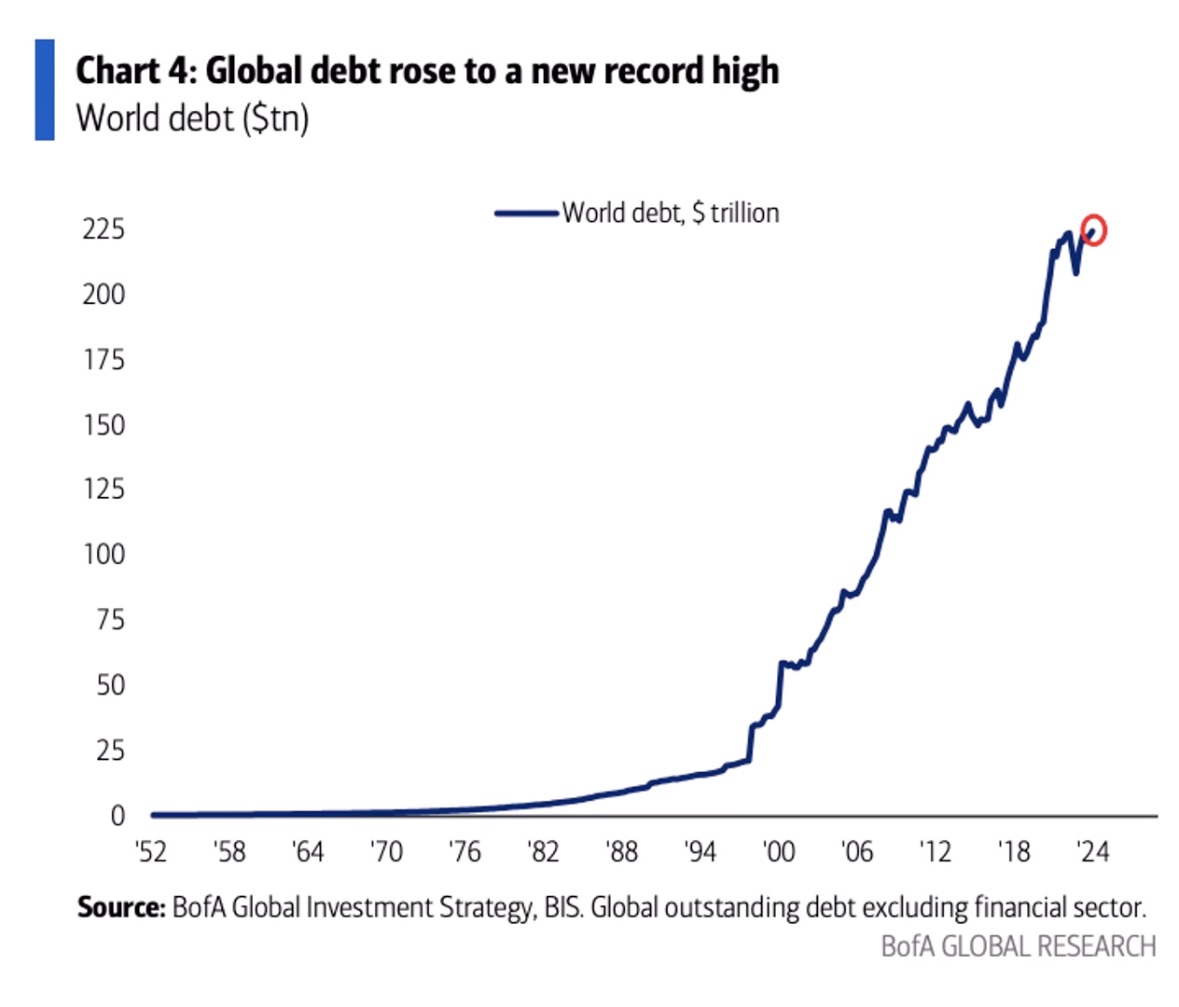
Global Debt, in Trillion USD, as of September 4, 2025. Source: Bank of America, Bank for International Settlements (BIS).
The global debt burden has reached historical dimensions and forms a significant breeding ground for rising gold prices. In the USA, government debt has more than sextupled since 2000 – from $5.77 trillion to currently $37.32 trillion. Globally, debt climbed to a record level of over $230 trillion and has been rising at a rapid pace since 1997.
With the end of the 40-year bond bull market in 2022, the situation is further exacerbated: Rising interest rates burden debt sustainability, while investors, due to high inflation, are only willing to finance longer-term debt at higher yields. Increasingly, states will be forced to buy back their own bonds.
The shift in the bond market has given gold a new role as an alternative investment vehicle. Particularly, rising interest rates and falling bond prices burden investors who traditionally flocked to fixed-income assets. As bonds now barely provide stable portfolio gains, precious metals gain considerable attractiveness as a hedge and diversification. A weak bond market is thus a structural tailwind for gold, as institutional investors seeking conservative yet valuable alternatives are left with hardly any real option – except recourse to gold.
3. Central Bank Gold Purchases
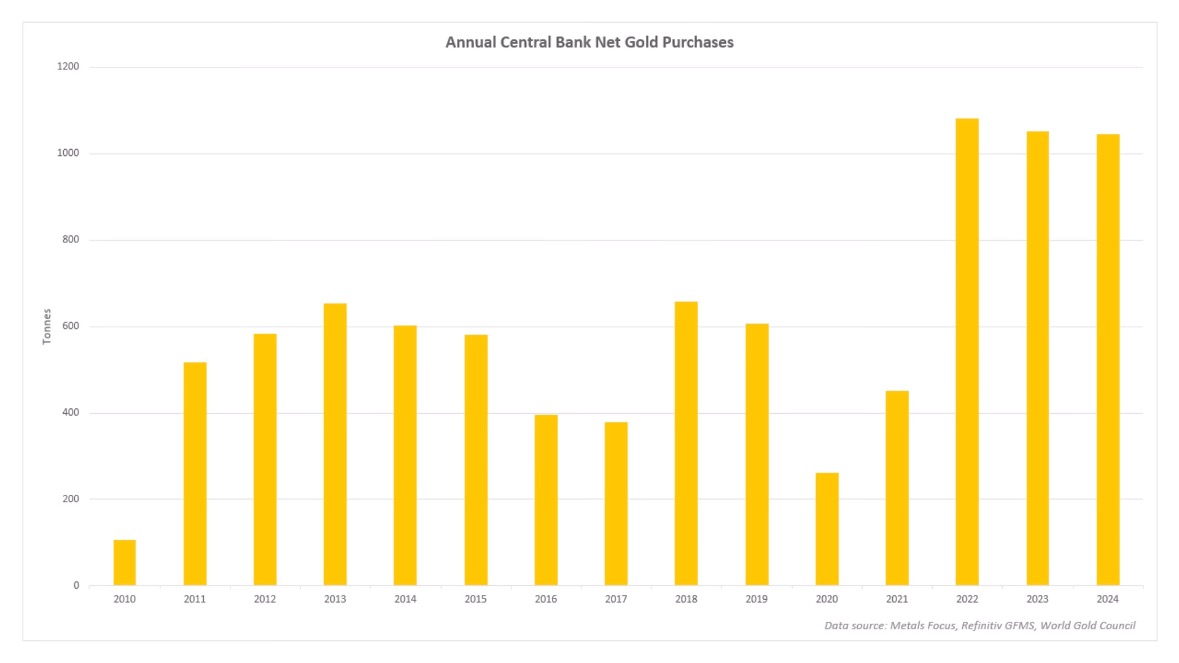
Annual Net Gold Purchases by Central Banks, as of September 4, 2025. Source: Metals Focus, Refinitiv GFMS, World Gold Council
For several years, numerous central banks worldwide have been acting as significant net buyers in the gold market. Their motives range from diversifying currency reserves and reducing dependence on the US dollar to hedging against geopolitical and monetary risks. The steady demand from these institutional players provides a stable foundation and simultaneously reduces the available supply in the market – a clear bullish signal for the gold price.
In particular, the People’s Bank of China (PBOC), the Chinese central bank, continues its massive gold purchasing strategy unabated and has continuously expanded its gold reserves in 2025. The holdings increased for the tenth consecutive month, reaching an official total of approximately 2,302 tonnes of gold (74.02 million troy ounces) in August 2025. In February 2025 alone, nearly 5 additional tonnes were purchased. These continuous purchases are part of a targeted diversification strategy, through which China aims to reduce its dependence on the US dollar and broaden its currency reserves.
Concurrently, China’s increasing gold holdings serve as a hedge against economic uncertainties and geopolitical risks. Beyond the official figures, experts suspect that China, as the largest gold producer, has accumulated far more gold through secondary market purchases than publicly disclosed, suggesting even higher actual reserves. The massive gold purchases by the Chinese central bank have significantly influenced the global gold market and contributed to the gold price’s upward movement over the past three years.
In addition to China, numerous other central banks worldwide are actively purchasing gold, further driving demand in the precious metals sector. For example, the National Bank of Poland increased its gold reserves by a considerable 49 tonnes in 2025, reaching a total of 497 tonnes. Countries such as India, Kazakhstan, and the Czech Republic also made significant purchases in the first months of the year. Overall, central banks net purchased approximately 244 tonnes of gold in Q1 2025, which, despite a slight decrease from the previous quarter, is still 24% above the five-year average.
These purchases reflect the increasing importance of gold as a strategic reserve asset, particularly in light of geopolitical tensions, inflation fears, and the desire of many states to reduce their dependence on the US dollar. For 2024, the World Gold Council recorded the 15th consecutive increase in global central bank gold reserves, with rising growth rates and a broad expectation that this trend will continue in the coming years.
4. China’s Gold Purchases and the Shanghai Gold Exchange
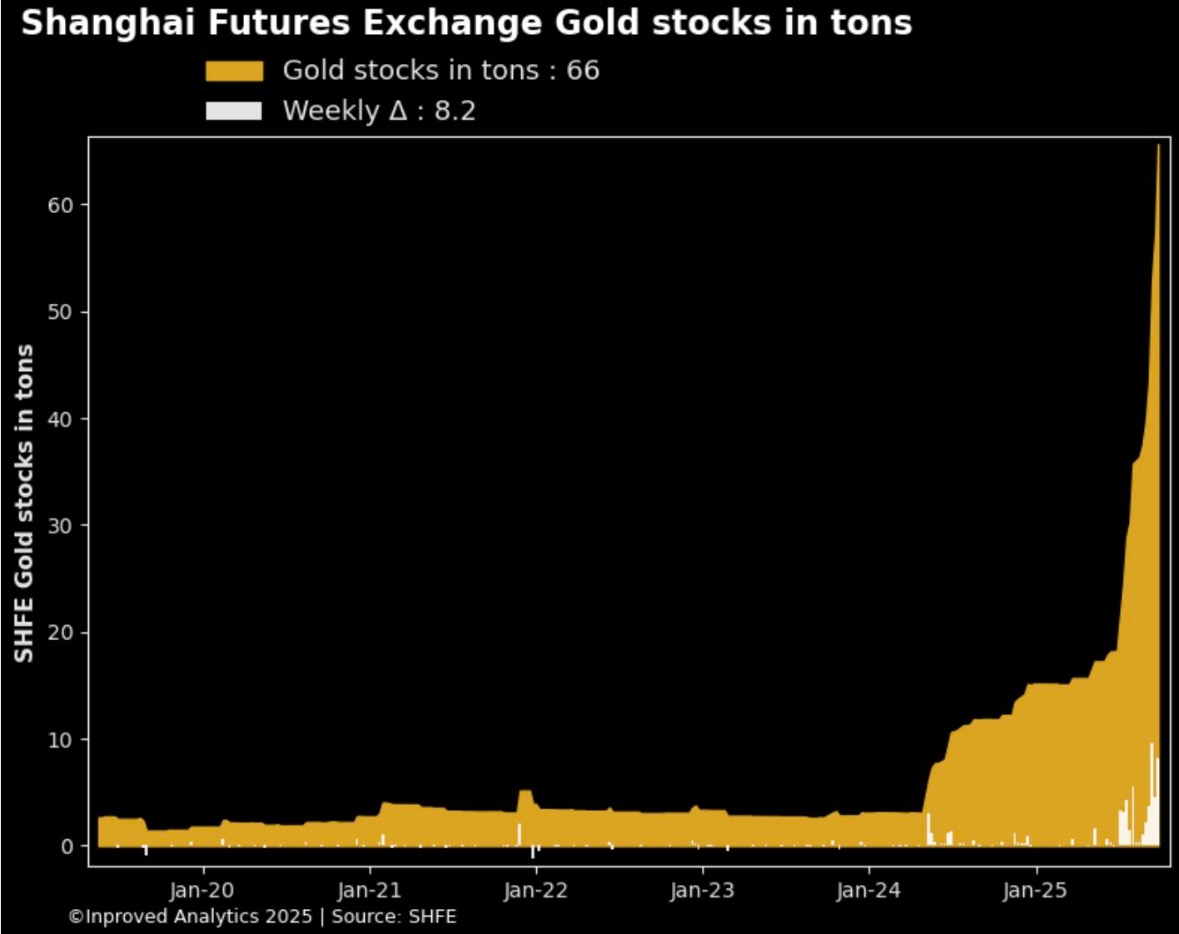
Shanghai Futures Exchange Gold Holdings in Tonnes, as of September 26, 2025. Source: InProved
Particular attention is paid to the strong gold demand from China. In addition to the central bank in Beijing, private households are also continuously expanding their gold holdings. The Chinese love gold, as, besides its cultural tradition, it plays a dual role here: as a strategic insurance against geopolitical tensions and as a preferred form of private asset protection, given that rigid capital market controls persist in China.
Unsurprisingly, the Shanghai Gold Exchange (SGE) now plays a decisive role in the global precious metals market, as it represents Asia’s largest precious metals exchange and the official gateway for physical gold trading in China. Since its establishment in 2002 and its opening to international participants in 2014, the SGE has developed into one of the most important trading venues for gold. Unlike Western markets, where paper gold or derivatives often dominate, the SGE primarily trades physical gold, which gives the exchange significant importance for actual gold demand.
Furthermore, through the SGE, China is establishing its own gold price, which is sometimes significantly higher than prices in Western markets such as London and New York. This is partly due to strong domestic demand and export controls. The SGE also serves as a strategic instrument for the Chinese central bank, which, as part of its gold policy, increasingly seeks to persuade international central banks to store gold reserves directly in Chinese vaults at the SGE. Thus, Shanghai positions itself as a global hub and competitor to established Western gold trading centers, while simultaneously strengthening Beijing’s influence in the global precious metals market and international finance.
This development makes the Shanghai Gold Exchange a central factor in price formation and physical gold trading worldwide. The paper jugglers in the West have therefore lost control of the gold market in recent years. China, on the other hand, has made a strategic power play in the global gold market and aims to gain control over foreign currency reserves in order to challenge and, in the medium term, break the dominance of the US dollar. The PBOC is actively encouraging friendly central banks to buy gold via the SGE and store it within China. This strengthens Beijing’s role in the global precious metals market and shifts the global financial status in favor of China.
The SGE acts as a central instrument, as it manages well over 12,000 tons of gold volume as the world’s largest physical precious metal exchange and offers an international platform for new gold purchases and storage. By building a “treasurer” status for foreign state reserves, China wants to change the existing financial system and reduce the influence of the dollar-based system. This step comes against the background of geopolitical tensions and global shifts in monetary policy.
Gold price rally: Liquidity, central banks and China’s influence
In summary, the four fundamental drivers – the massive expansion of global liquidity, the bear market in bonds, the ongoing gold purchases by central banks and the special role of China and the Shanghai Gold Exchange – form the foundation for the current gold price rally. The steady erosion of the purchasing power of the US dollar through an unprecedented expansion of the money supply, coupled with the debt crisis and the volatility of traditional investments, makes gold indispensable as a safe store of value for investors.
Even players from completely different market sectors are reacting to this: A notable example is the weekly gold purchases of Tether Holding, which acquires at least one ton of physical gold per week to secure the gigantic interest gains from its stablecoins in tangible assets. This additionally supports the demand for physical gold and intensifies the scarcity on the market.
Among the central banks, China in particular, with its aggressive gold buying strategy, as well as other nations such as Poland, India and Kazakhstan, are key players that are having a lasting impact on the gold market. The Shanghai Gold Exchange acts as a globally important hub for physical trading, strengthens China’s global influence and changes market mechanisms in favor of higher physical demand.
This combination of macroeconomic conditions and institutional demand pressure is currently creating an extremely robust starting position, which should push the gold price further up in the medium and long term.
6. Conclusion: Gold – Euphoria with warning signs on the horizon
After months of sideways movement, the gold price resumed its impressive upward momentum in late summer. With a new all-time high of 3,791 US dollars, the fine ounce has now risen in price by almost 44.5% since the beginning of the year on a US dollar basis. The silver price in particular has risen significantly in recent weeks and is increasingly emancipating itself from the gold price.
From a chart perspective, gold is overbought, and the momentum has weakened somewhat in recent days. As silver is now increasingly taking over the scepter, there are increasing signs of an imminent correction. In the short term, silver is likely to target its all-time high of around USD 50, which could bring the gold price at least above the USD 3,800 mark to around USD 3,850. In the best case scenario, around USD 4,000 would be conceivable this fall.
We then expect a sharp correction, which should temporarily frighten inexperienced precious metal investors in particular. The next upward trend reversal could then take place in mid-December at the latest. However, the overriding long-term upward trend remains unaffected and should lead gold to new highs above 4,000 and 4,300 US dollars by next spring.
Florian Grummes
Precious metal and crypto expert
www.midastouch-consulting.com
Free newsletter
Source: www.celticgold.de


