October buy signal still valid
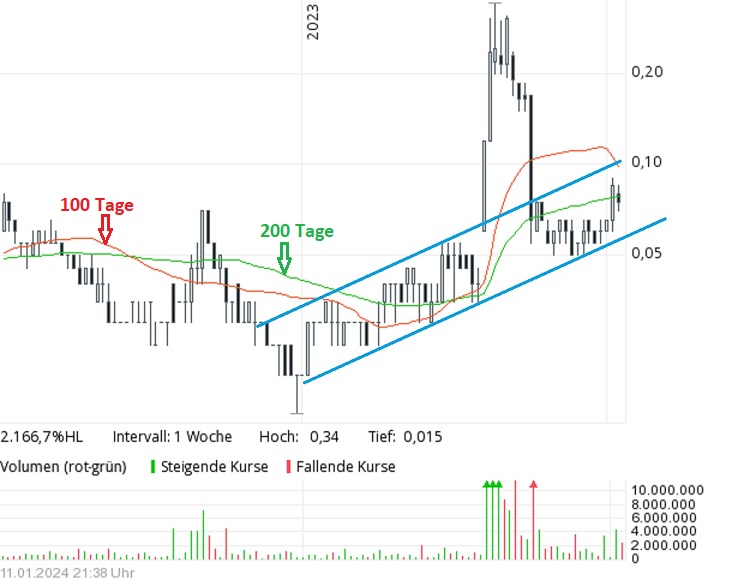
The share price of Canadian gold explorer Aston Bay (WKN A2AUFP / TSXV BAY) has been rising steadily within the blue trend channel since the beginning of last year. In August, the price broke out to the upside amid massive turnover and multiplied within a few days. At the end of September, it quickly fell again – back into the trend channel without breaching its lower limit.

Source: Comdirect
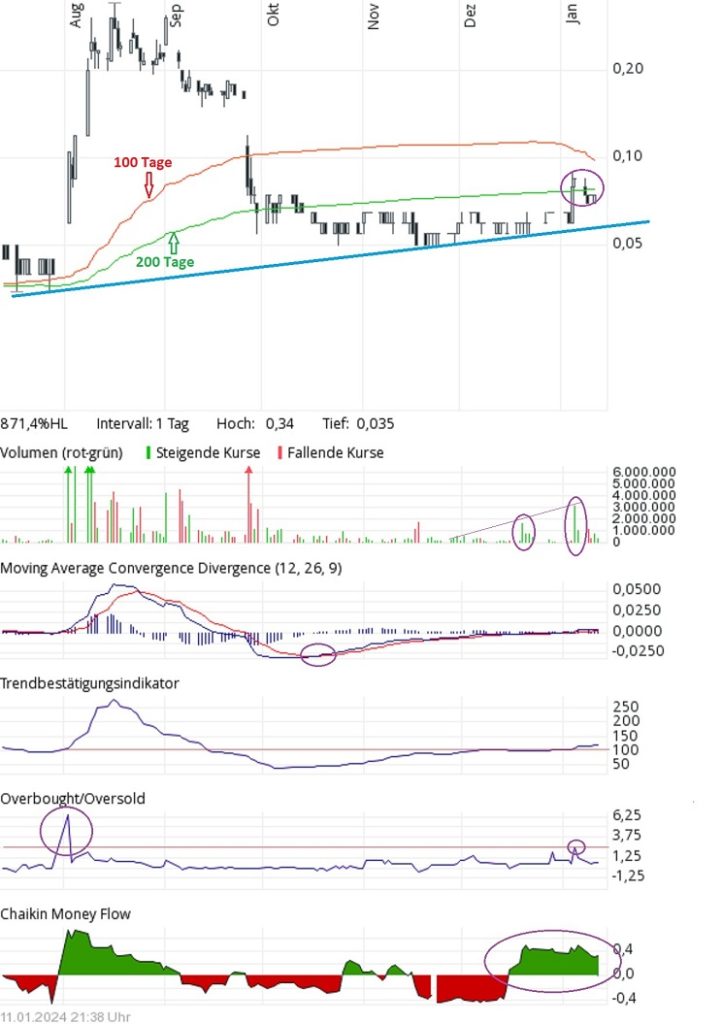
The strong breakout also pulled the average lines upwards, with the result that the share price fell below both lines once it had normalized. At present, however, the price seems to have succeeded (accompanied by spikes in turnover) in crossing the 200-day line again, which continues to rise slightly. The 100-day line is still above the 200-day line – which is positive – but is currently in reverse gear.
Some indicators were also driven to extremes by the price explosion, but have been able to return to normal volatility in recent months. A technical buy signal was already generated by the MACD in mid-October (blue line crosses red line upwards) and is still valid – albeit narrowly. At the beginning of the year, the trend confirmer managed to overcome the neutral 100 and return to positive territory. The price spike in January pushed the overbought/oversold indicator into overbought territory in the short term at 2.0. Currently, this indicator is clearly in the positive zone at around 1.0, but is in no way overheated. The Chaikin Money Flow indicator, which shows the flow of capital into the share, has expanded significantly into the green zone since mid-December.
On another positive note, the share price (even excluding the upward peak) has risen by around 100% between July and today.

Source: Comdirect
Risikohinweis: Die Inhalte von www.goldinvest.de und allen weiteren genutzten Informationsplattformen der GOLDINVEST Consulting GmbH dienen ausschließlich der Information der Leser und stellen keine wie immer geartete Handlungsaufforderung dar. Weder explizit noch implizit sind sie als Zusicherung etwaiger Kursentwicklungen zu verstehen. Des Weiteren ersetzten sie in keinster Weise eine individuelle fachkundige Anlageberatung, stellen vielmehr werbliche / journalistische Texte dar. Leser, die aufgrund der hier angebotenen Informationen Anlageentscheidungen treffen bzw. Transaktionen durchführen, handeln vollständig auf eigene Gefahr. Der Erwerb von Wertpapieren birgt hohe Risiken, die bis zum Totalverlust des eingesetzten Kapitals führen können. Die GOLDINVEST Consulting GmbH und ihre Autoren schließen jedwede Haftung für Vermögensschäden oder die inhaltliche Garantie für Aktualität, Richtigkeit, Angemessenheit und Vollständigkeit der hier angebotenen Artikel ausdrücklich aus. Bitte beachten Sie auch unsere Nutzungshinweise.
Laut §34 WpHG möchten wir darauf hinweisen, dass Partner, Autoren und/oder Mitarbeiter der GOLDINVEST Consulting GmbH Aktien von Laramide Resources halten können oder halten und somit ein Interessenskonflikt bestehen kann. Wir können außerdem nicht ausschließen, dass andere Börsenbriefe, Medien oder Research-Firmen die von uns besprochenen Werte im gleichen Zeitraum besprechen. Daher kann es in diesem Zeitraum zur symmetrischen Informations- und Meinungsgenerierung kommen. Ferner besteht zwischen Laramide Resources und der GOLDINVEST Consulting GmbH ein Beratungs- oder sonstiger Dienstleistungsvertrag, womit ein Interessenkonflikt gegeben ist.


