MACD indicator gives buy signal
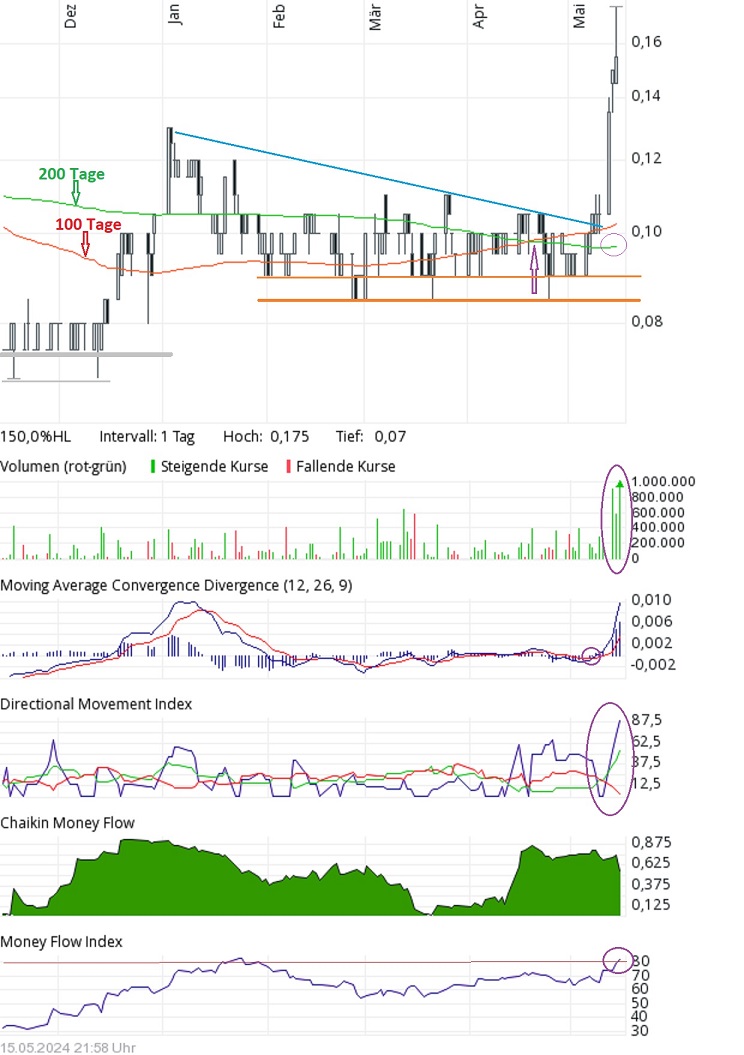
After the end of the downward trend was analyzed in the last chart check of Canadian base metal explorer Cerro de Pasco Resources (CSE CDPR / WKN A2N7XK), the positive development that followed can be seen in the current six-months chart.
The bottom formation from the winter months (gray lines) led to a price peak, which was followed by a four-month consolidation. The slightly falling blue trend line and the new support zone (orange lines), which is higher than the previous one, formed a solid base. A few days ago, the share price literally exploded and effortlessly overcame the blue line and both average lines (accompanied by very high turnover), reaching a new twelve-month high intraday.
100-day average has been rising since March
The 100-day line has been rising since March and crossed the 200-day line upwards three weeks ago (which is considered a medium-term technical buy signal). The 200-day line has also been moving upwards again for a few days – albeit only imperceptibly so far.
The MACD indicator generated a technical buy signal in the first few days of May (the blue line crosses the red line upwards), which is currently gaining in strength. The DMI is just as positive – the green line has risen above the falling red line and continues to move upwards. The blue line indicating trend strength is also continuing to rise. The Chaikin Money Flow repeats the striking picture from the previous chart check. According to the way this indicator is calculated, the almost exclusively green movement indicates an inflow of capital into the share over the entire period – currently again at a very high level. The Money Flow Index (sales-weighted relative strength RSI) could have more of a dampening effect. It has just risen above the value of 80 – from here the indicator is considered overbought.

Newsletter Anmeldung
Disclaimer: The contents of www.goldinvest.de and all other information platforms used by GOLDINVEST Consulting GmbH are intended solely for the information of readers and do not constitute any kind of call to action. Neither explicitly nor implicitly are they to be understood as a guarantee of any price developments. Furthermore, they are in no way a substitute for individual expert investment advice, but rather represent advertising/journalistic texts. Readers who make investment decisions or carry out transactions on the basis of the information provided here do so entirely at their own risk. The acquisition of securities involves high risks that can lead to the total loss of the capital invested. GOLDINVEST Consulting GmbH and its authors expressly exclude any liability for financial losses or the guarantee that the content of the articles offered here is up-to-date, correct, appropriate and complete. Please also note our terms of use.
In accordance with §34 WpHG, we would like to point out that partners, authors and/or employees of GOLDINVEST Consulting GmbH may hold or hold shares in the companies mentioned and therefore a conflict of interest may exist. Furthermore, we cannot rule out the possibility that other stock market letters, media or research companies may discuss the stocks we discuss during the same period. As a result, information and opinions may be generated symmetrically during this period. Furthermore, there may be a direct or indirect consultancy or other service contract between the companies mentioned and GOLDINVEST Consulting GmbH, which may also give rise to a conflict of interest.


