In our last gold chartbook from March 19th, 2021, we assumed that gold had likely started its typical correction in spring. At the same time we figured, that the first leg down from US$2,070 to US$1,895 might have run its course and that a strong bounce back to US$1,960 and maybe even above US$2,000 should follow. So far, gold made it back to US$1,965 last Friday, but has since then sold off strongly once again. Gold – The big boys are playing Yoyo.
With a large trading range between US$1,930 and US$1,890 yesterday was another memorable trading day in the gold market. Already the start into this trading week had a stale flavor as gold dropped to US$1,917 on Monday.
First notice day of COMEX April futures on Thursday
The background story might once again be a toxic mix of institutional window-dressing towards the end of the quarter coupled with the expiry date of the COMEX April gold options as well as the expiration of the April future contracts. Next is the first notice day of COMEX April futures on Thursday, March 31st. Hence, whoever is long gold April contracts at the close of today has to have the account fully funded (full price of the contract) with the intention to take physical delivery.
The big boys and the bullion banks are playing this game pretty successful for decades already. Their goal is to discourage long gold contract holders from taking physical delivery and spook retail money from buying gold with these crazy, volatile moves. On top, the current macro setup warrants further attacks on gold, as the petrodollar system is under severe pressure due to the sanctions against Russia and the exclusion of Russia from the Swift system. Russia will only accept rubles, oil and bitcoin for its gas and oil. A move that shady dictators paid with their power and their lives in the past. However, Russia is a different caliber though, and we can only hope that the warmongers in the east and west will calm down quickly. Realistically, however, we must rather assume the worst!
In the very short-term, gold might remain under pressure, even though yesterday’s V-recovery is looking promising. On the first notice day and thereafter, gold might then be allowed to more or less freely trade again.
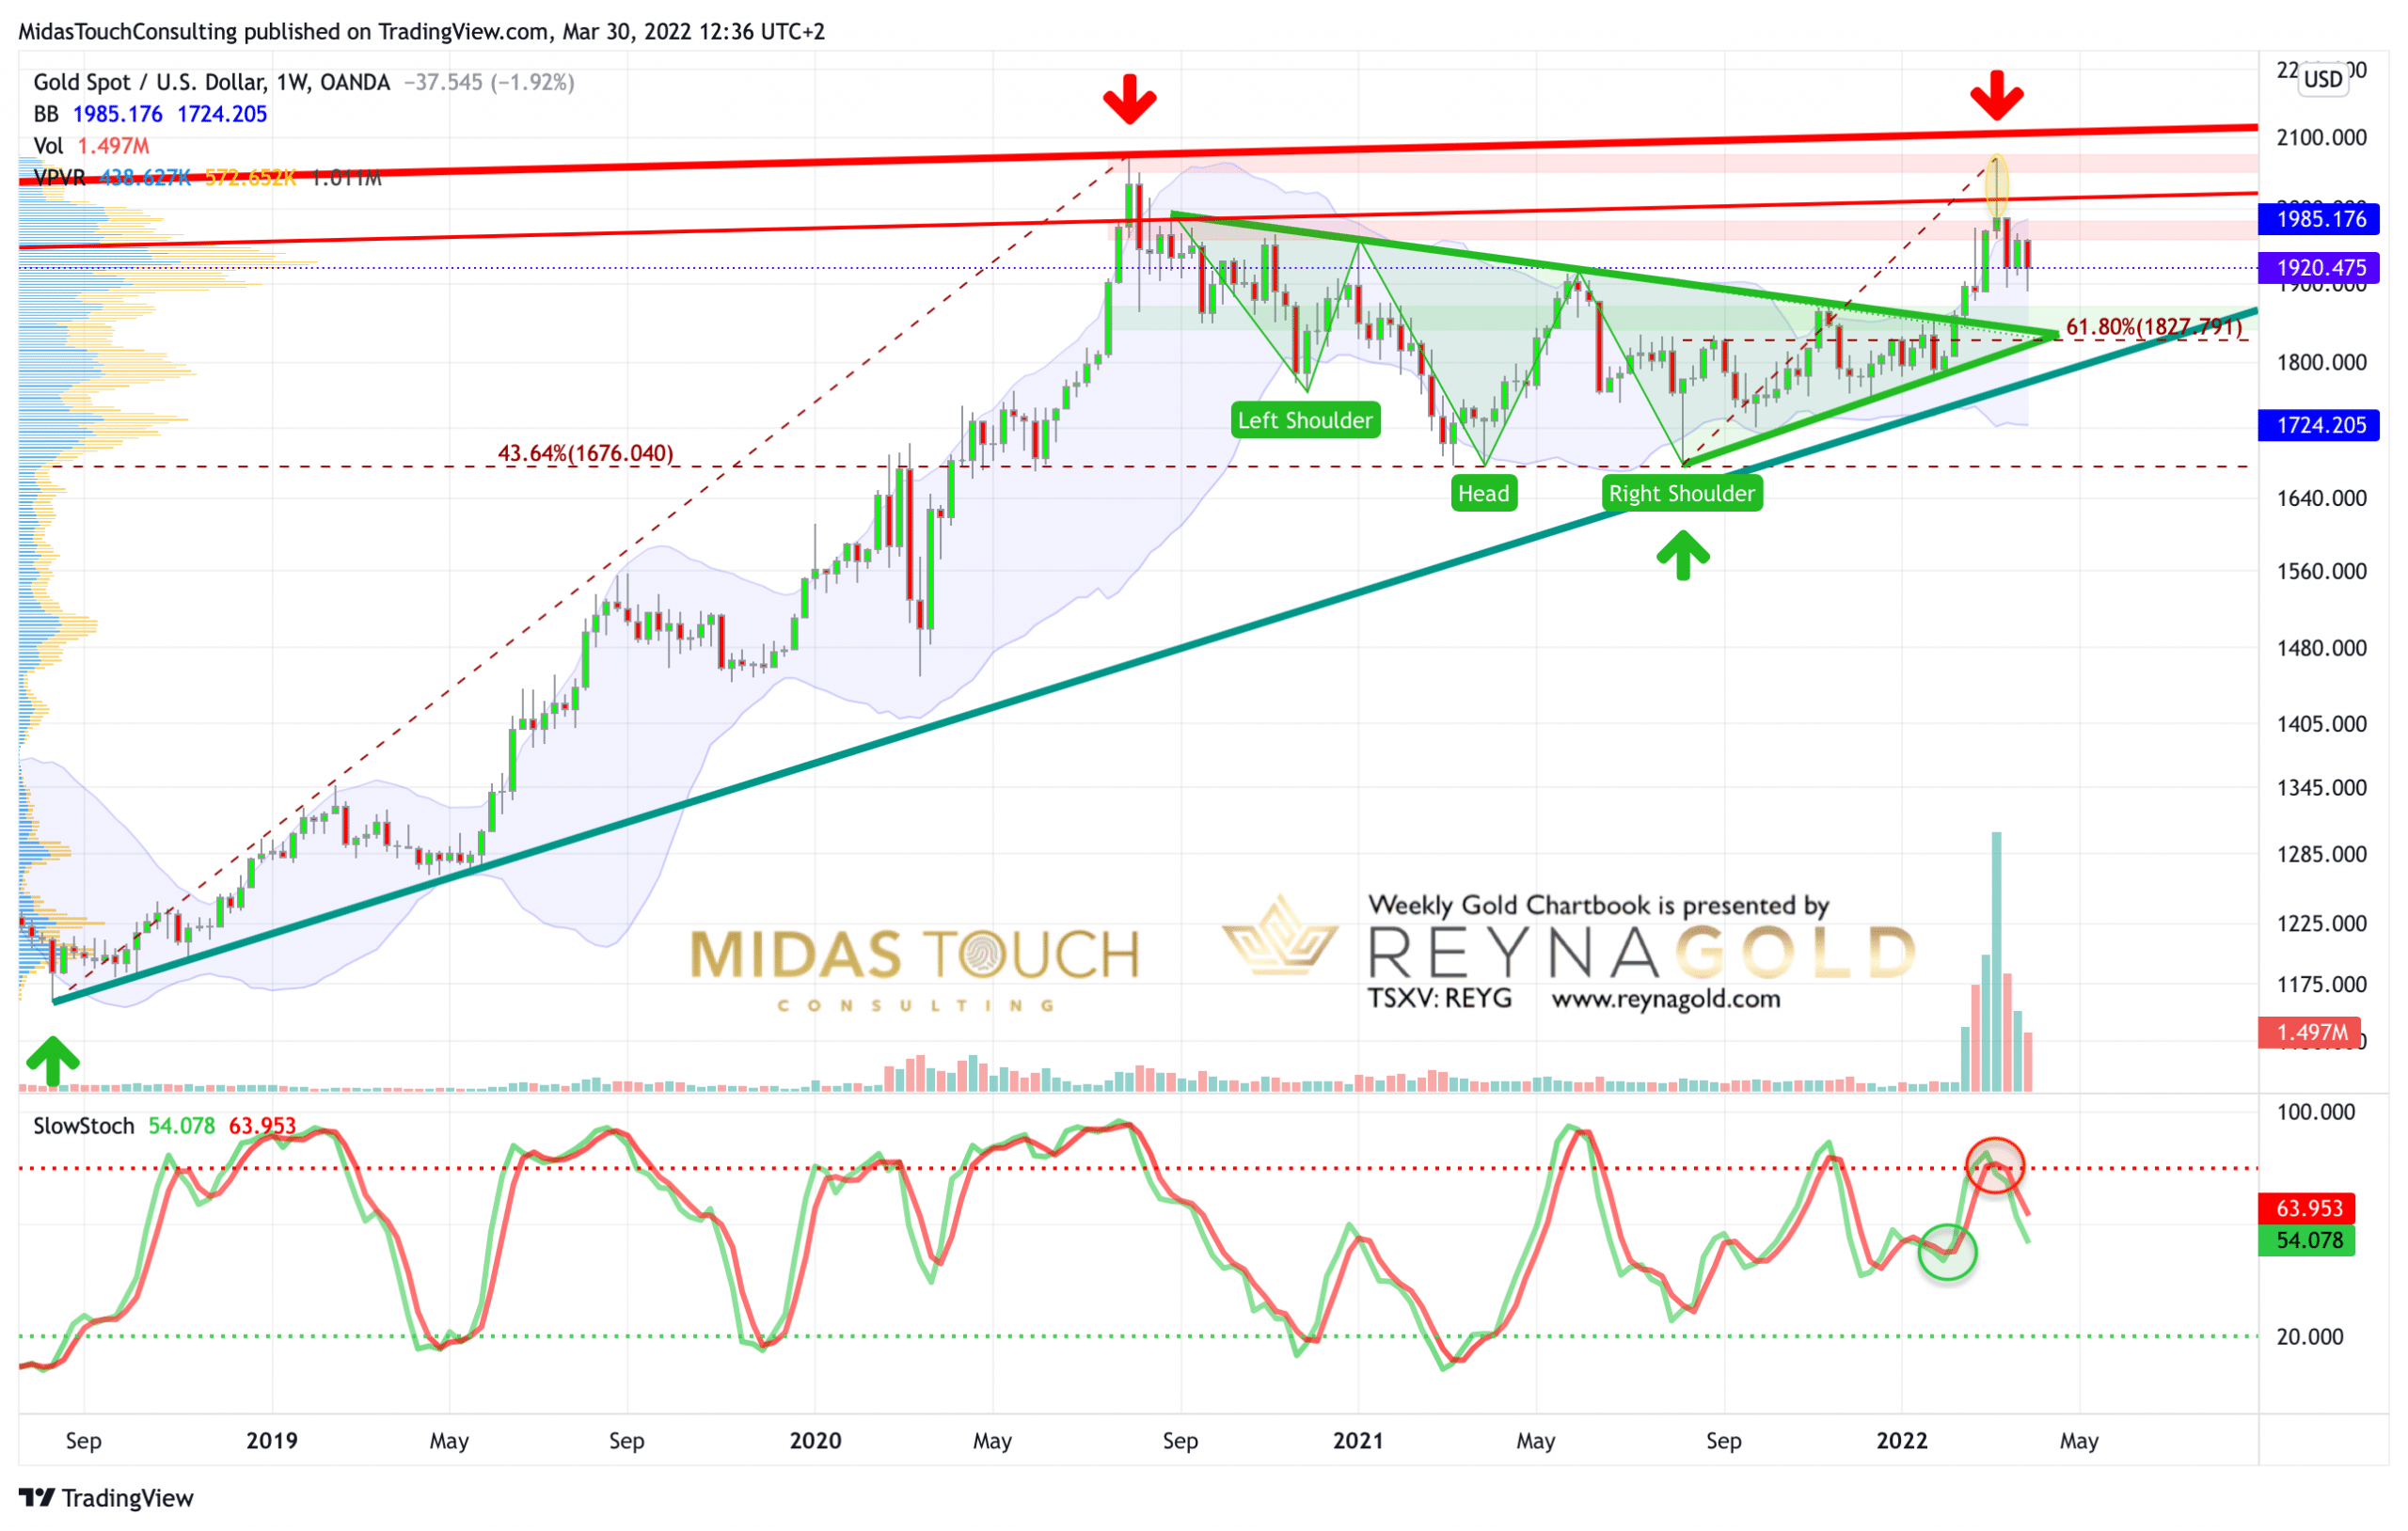
Gold in US-Dollar, weekly chart as of March 30th, 2022.

Gold in US-Dollar, weekly chart as of March 30th, 2022.
On the weekly chart, the big reversal candle still dictates the picture. Due to that, we have to assume that at some point gold will need to test the triangle breakout zone around US$1,820 to US$1,850. However, this could take months.
For the last two weeks, gold has been trading sideways in a very volatile fashion between US$1,890 and US$1,965. The long wicks indicated that prices between US$1,890 and US$1,915 might encourage buyers to step in again. Obviously, this support has to hold. Otherwise, more downside will be activated.
Since the stochastic oscillator is on a sell signal, gold remains vulnerable in the medium term. It will take much more time until the oscillator would reach its oversold zone for a contrarian buy signal.
Overall, the weekly chart is bearish and continues to advise caution and patience.
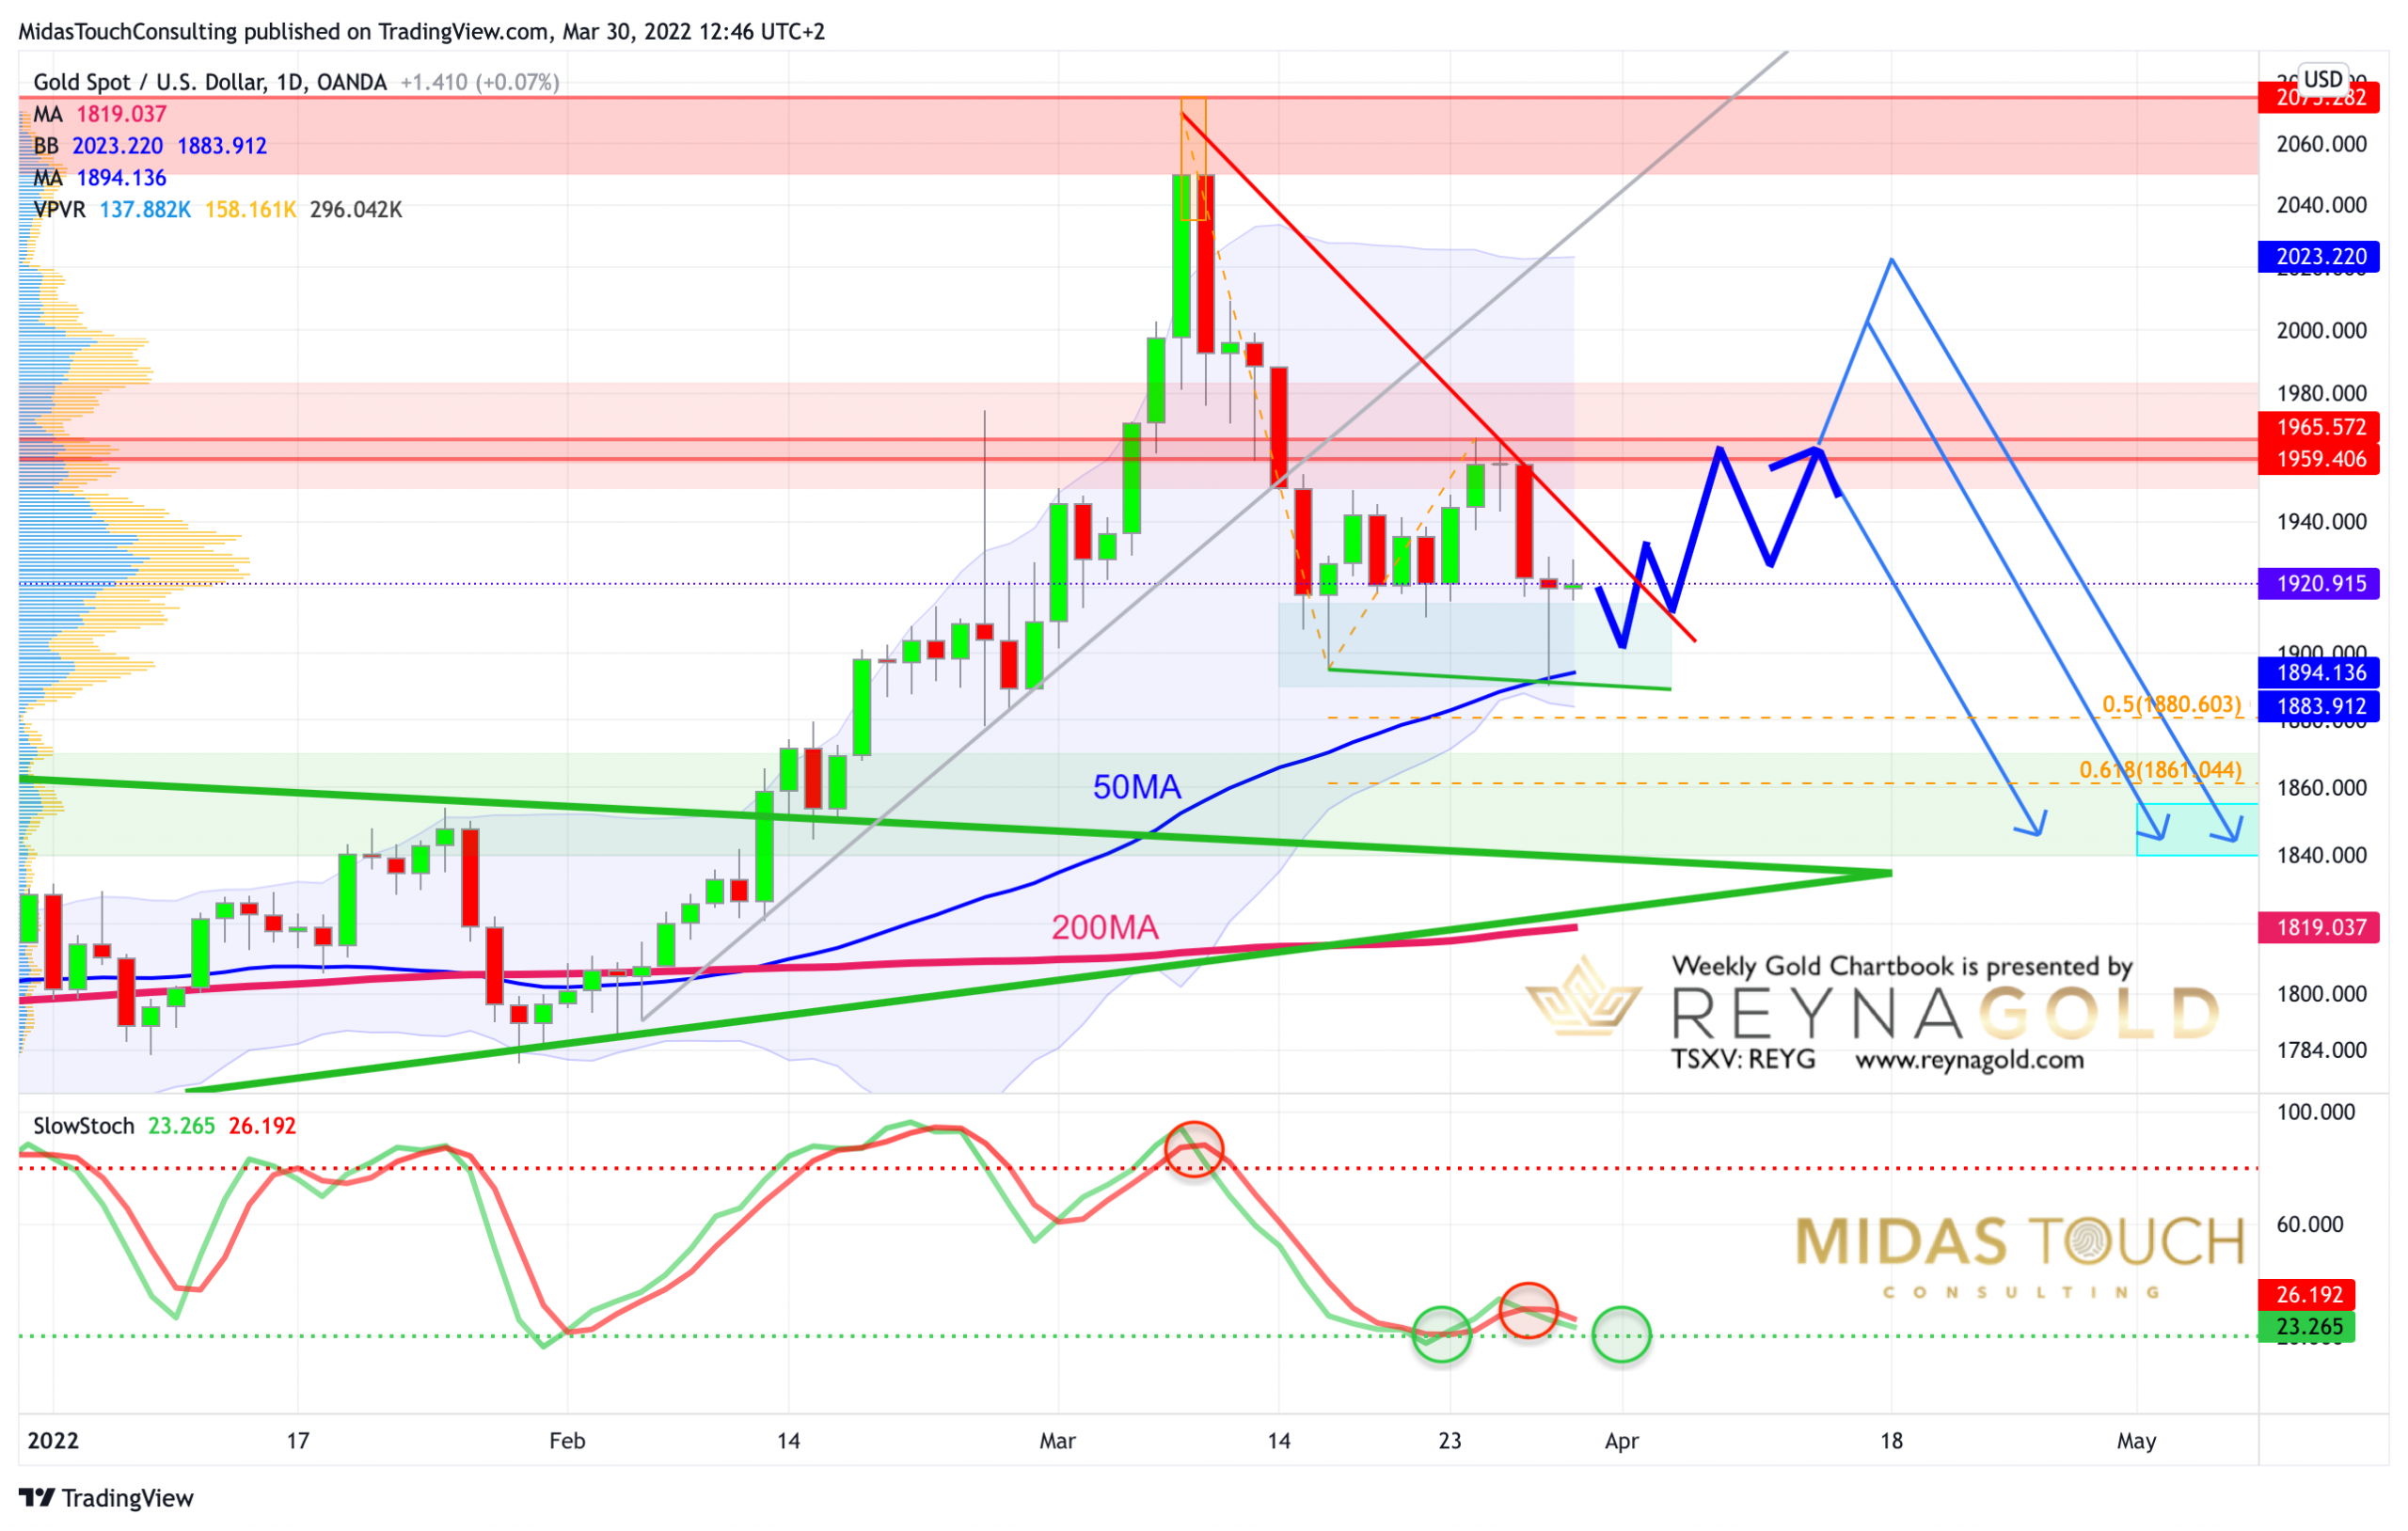
Gold in US-Dollar, daily chart as of March 30th, 2022.

Gold in US-Dollar, daily chart as of March 30th, 2022.
The rather good news is coming from the daily chart since the stochastic oscillator is kind of oversold and hence in a promising position for another recovery rally. A bounce back to last Friday’s high at US$1,965 seems possible. And even a further recovery towards US$2,000 still seems possible.
Overall, the daily chart is once again slightly oversold and gold might start another bounce soon.
Conclusion: The big boys are playing Yoyo
With inflation moving towards double digits, worldwide energy and food supply in danger and a war in Ukraine, whose end is unfortunately not in sight, everyone is well advised to park part of their assets in the safe haven of physical precious metals. While the fundamentals for gold are more bullish than ever, the price action has been a nerve-wracking roller coaster over the last few weeks. It seems that this is the only way to hold off a mainstream run into gold.
However, with many central banks (especially in the Middle East) urgently needing to diversify out of their US-Dollar nominated assets and Russians now trading oil for gold, gold prices should remain well-supported for the time being. At the same time, a deflationary spiral is constantly lurking in the background. Just two days ago, the G7 countries rejected the Russian demand for gas and oil payment in rubles. However, the German industry desperately needs the Russian natural gas for its plants. An expert from BASF warned of the dramatic consequences of an immediate import stop for the chemical giant. A production stop due to energy shortages would be disastrous and very deflationary, of course.
Furthermore, central bankers in the U.S. and the EU as well as in China and many other countries will have to continue expanding the money supply anyway, otherwise liquidity-dependent markets and hence all asset prices would suffer severe withdrawal symptoms and would be taken down sharply, too.
Yet, while technically nearly everything speaks for an ongoing breakout above the multi-year cup & handle pattern in the gold market, such a deflationary wave could hit gold as well. In fact, gold is a master of anticipating such upheavals.
Another bounce is likely
For now, we assume that gold should hold its support around US$1,880 and US$1,915 and start another bounce within the next few days. This bounce could take prices back towards the well-known resistance zone around US$1,960. We also see some chances for a larger bounce back towards and slightly above US$2,000.
To summarize, gold should soon rally towards US$1,960 again. A weekly close below US$1,900, however, would cloud the picture significantly and the bears will likely shift up a gear. On the upside, the bulls need a convincing close above US$2,030 to come back into control of all important timeframes.
Feel free to join us in our free Telegram channel for daily real time data and a great community. If you like to get regular updates on our gold model, precious metals and cryptocurrencies you can also subscribe to our free newsletter.
Disclosure: Midas Touch Consulting and members of our team are invested in Reyna Gold Corp. These statements are intended to disclose any conflict of interest. They should not be misconstrued as a recommendation to purchase any share. This article and the content are for informational purposes only and do not contain investment advice or recommendations. Every investment and trading move involves risk, and readers should conduct their own research when making a decision. The views, thoughts and opinions expressed here are the author’s alone. They do not necessarily reflect or represent the views and opinions of Midas Touch Consulting.


