1. Review
We had suspected that the last US interest rate decision in mid-December should bring a bottom and the upward trend reversal in the gold market. Indeed, the gold price punctually recorded the end of its almost two-month correction on December 18th with a low of $2,585. Subsequently, since the beginning of the year, the gold bulls have clearly taken control again and driven gold prices upwards at a breathtaking pace.
First, the all-time high from the end of October at $2,790 was overrun without much resistance. A new all-time high of $2,942 was finally marked three weeks ago. In the area around $2,940, for the first time in almost two and a half months, more sellers than buyers appeared, so that the gold price recorded a small double top and consolidated around the psychological mark of $2,900 for about a week. However, during the following trading week, the bulls managed to break out to a new all-time high of $2,956. Overall, this resulted in an increase of 12.50% since January 1, 2025.
This strong upward movement was favored by numerous factors, with the shift of large amounts of physical gold from London to New York obviously playing an important role. As a result, the London gold market is currently facing significant challenges. In January alone, 151 tons were withdrawn from London vaults. In the last two months, even 12.2 million ounces of gold were shipped to COMEX warehouses in the USA.
This trend has led to a shortage of physically available gold in London, which in turn is causing delays in delivery. Waiting times for gold withdrawals from the Bank of England’s vaults have extended from a few days to four to eight weeks. This situation was exacerbated by the increasing demand for gold as a safe haven, driven by geopolitical tensions and inflation fears, as well as the buying frenzy in China at the beginning of the Chinese New Year (Year of the Snake). At the same time, the long delivery times are arousing mistrust.
The fear of possible new US trade tariffs on precious metals was cited as a main reason for the massive relocation of gold stocks from London to New York. The audit of US gold reserves announced by the Trump administration could also be a possible reason. In addition, there is also the fact that large financial institutions regularly take advantage of price differences between trading venues to profit from arbitrage transactions. Furthermore, it is quite possible that the Trump administration is working on a new financial system backed by gold in some form.
In any case, this massive reallocation has led to a critical supply situation in London. According to the London Bullion Market Association (LBMA), the available gold stocks at the end of January amounted to approximately 8,535 tons. Even if the ‘unallocated’ gold should actually just not be in the right size in the right place, the LBMA could not reassure market participants with its statement.
In the last trading week, which was characterized by the roll-over of the February future contract and the month-end closing price, the bears managed to successfully defend the important resistance zone around $2,955. Ultimately, the overheated gold price was pushed down in two stages from $2,956 to below the $2,900 threshold and finally to $2,832 within five trading days.
At the start of the current week, however, the gold price can already make up around $90 and recovers to $2,921. With this ‘v-shaped recovery’, the pullback, which has so far been classified as healthy, is probably already over. The chances for a continuation of the rally clearly outweigh.
2. Chart Analysis Gold in US Dollars
2.1 Weekly Chart: After Eight Green Weekly Candles Comes the Pullback

Gold in US Dollars, Weekly Chart from March 4, 2025. Source: Tradingview
The healthy pullback starting from the high of $2,790 on October 31st already found its low at $2,535 on November 14th. However, the correction stretched out over time, as a slightly higher low of $2,585 was only reached on December 18th. Overall, the consolidation triangle took about two and a half months.
As expected, this triangle was resolved to the upside on January 15th with a breakout above $2,675. Subsequently, the gold price knew no bounds. Initially, the all-time high of $2,790 was surpassed without much resistance. Afterward, the gold price continued to surge almost daily, eventually reaching a new all-time high of $2,956.
Only in the last three weeks did the resistance zone between $2,942 and $2,956 cause two sharp pullbacks towards $2,864 and $2,877, as well as a severe sell-off back to $2,832. This has at least interrupted the impressive rally on the weekly chart after eight consecutive green weekly candles.
So far, the technical damage remains very limited. Although the weekly stochastic has been in the overbought zone since the end of January, there are (still) no signals for an immediate end to the upward movement. Instead, the weekly stochastic continues to move in a bullishly embedded state.
The potential for a larger correction would certainly be present after the strong rise of the last two and a half months. However, since the silver price has not yet made its voice heard, we assume that the high ($2,956) from a week ago is not a significant peak!
Overall, the weekly chart remains bullish and still suggests a rise above $3,000 as the primary scenario. However, the situation would change with a weekly closing price below $2,790. In that case, the gold price would have completed a top formation above $2,900 in recent weeks. Above the broad support zone between $2,865 and $2,890, the overall picture remains clearly bullish.
2.2 Daily Chart: V-shaped Recovery

Gold in US Dollars, Daily Chart as of March 4, 2025. Source: Tradingview
After the situation had become extremely overbought due to the strong rally of over $350, the gold price desperately needed to take a breather. In a very short time, the sharp pullback to $2,832 in the previous week had already created panic among investors and trend followers. While most market participants had been chasing the gold price for weeks, no one dared to buy the deep dip at the beginning of the week.
It’s important to know that the February future on the gold price expired at the end of the month on Friday. This caused increased hectic activity, as professional traders in particular must either deliver or roll over the contract. All major professional market participants tried to move prices in the direction most favorable to them. This is not just about rolling, but also about cash settlements and the expiration of options. When large banks, which are often net short positioned, push the price down, they have to pay less for options and cash settlements, while long positions suffer losses. A price decline below certain thresholds can cause call options above this strike price to become worthless. Similar to the “Triple Witching Days” in the stock markets, there is a “sweet spot” where the net value of all put and call positions is most favorable for the banks.
Accordingly, the sell-off in the past trading week was probably due to an orchestrated suppression action to generate a monthly closing price clearly below $2,900 and render all previously sold options of the last three weeks worthless. With the strong recovery at the start of the week in the first week of March, the selling pressure has already disappeared again.
In summary, the daily chart is bullish and provides a new buy signal. A rise above $2,930 clears the way for an attack on the new all-time high of $2,956. Subsequently, the gold price should be able to push further towards $3,000 +x.
A much less likely alternative would be for the current recovery to fail around $2,920 to $2,930, followed by a search for a second leg above Friday’s low of $2,832.
3. Gold Futures Market Structure

Commitments of Traders Report for the Gold Future as of February 25, 2025. Source: Sentimenttrader
At the closing price of 2,918 USD on Tuesday, February 25, commercial traders held a cumulative short position of 288,100 gold futures contracts. Given the strong rally of over 350 USD since mid-December, the commercial short position has increased surprisingly little. At the same time, these short positions have further gone underwater, and the professionals may have started to sweat recently. Presumably, numerous contracts were covered during the price drop to 2,832 USD on Thursday and Friday.
Based on the last 20 years, the CoT Report remains very negative and clearly bearish. It would require significantly lower gold prices before this analysis component could be interpreted as neutral or even counter-cyclically bullish. At the same time, the significance of the CoT Report seems very limited given the problems in the physical gold market in London.
4. Gold Sentiment

Sentiment Optix for Gold as of March 3, 2025. Source: Sentimenttrader
After a healthy cool-down in November and December, sentiment in the gold market quickly became euphoric again since the beginning of the year. However, thanks to the sharp pullback from 2,956 USD to 2,832 USD, a lot of hot air has already escaped. Currently, the Sentiment Optix for Gold is at 71 out of 100 points, just below the euphoria zone.
In the past, an excessively optimistic sentiment could sometimes persist for months, with occasional ‘cold showers’ like the one last week necessary to curb the greed of market participants. In this respect, sentiment is no longer standing in the way of a continuation of the rally at the moment.
In sum, optimism in the gold market is too high.
5. Gold Seasonality

Seasonality for the gold price over the last 15 years as of May 6, 2024. Source: Seasonax
Without a doubt, the gold price is in its best phase of the year. In the past, this phase has almost always led to significant increases from mid-December or the beginning of the year until spring, sometimes even into early summer.
Accordingly, the rally should have at least a few more weeks to run. The peak could be seen between mid-March and mid-May. Especially if silver were to have a steep run for a few weeks as well, we would have, in addition to seasonality, another strong indication of an approaching top in precious metal prices.
Overall, seasonality is strongly bullish and should drive precious metal prices to new highs in the coming one to three months.
6. Macro Update – Wild Roller Coaster Ride in the Turbo Casino 2025
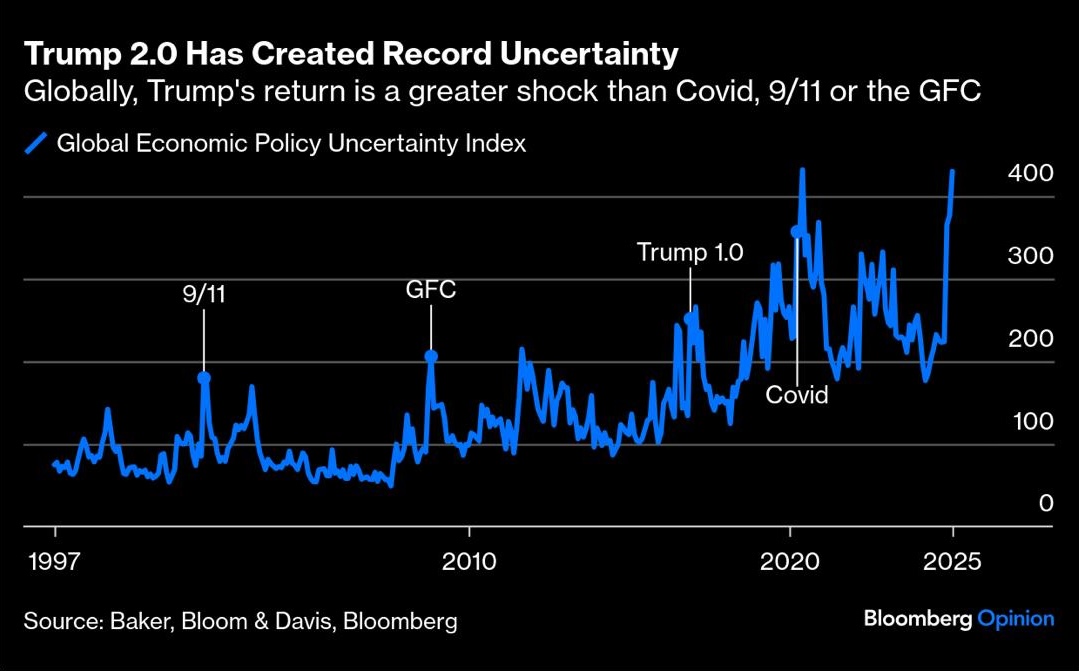
Trump 2.0, however, has created record uncertainty. Source: Baker, Bloom Davis, Bloomberg
Uncertainty is an inherent part of change, and those who fear uncertainty are doomed to fail!
Although we may experience an extremely wild roller coaster ride in the coming months as the new US administration attempts to implement many positive, radical, and revolutionary changes, the medium-term outlook is extremely bullish for tangible and financial assets.
Unwinding of the “Trump Trade”
While 2024 proved to be exceptionally positive for most market sectors, the first two months of 2025 paint a different picture. The “Trump Trade,” which boosted digital assets in particular at the end of 2024, has undergone a correction. And within just six weeks of his inauguration, US President Donald Trump has created record uncertainty through a series of far-reaching changes and controversial policies.
Trump signed about 70 decrees and orders within his first month in office, far more than any previous president in a similar period. Many of these orders are being challenged in court, further increasing legal and political uncertainty. While these rapid and often controversial measures have created a climate of uncertainty in domestic and foreign policy matters, his economic decisions such as mass layoffs in federal agencies and efforts to cut spending and reduce federal bureaucracy are all rather business-friendly. However, they will only take effect in a few months.
It is therefore not surprising that the markets, challenged by the unfamiliar and unpredictable new style of US politics, have become much more volatile. Wild fluctuations can be observed in many sectors. For example, since January 20, Bitcoin fell from $110,000 to $78,600 (-28%), but then suddenly recovered to $95,000 (+21%) last Sunday when Trump announced his plans for a US Bitcoin reserve. However, at the start of the week, a large part of the increase was given up again. This extreme volatility creates great uncertainty and increases the unrest among market participants.
Gold Takes the Lead
Meanwhile, gold has experienced an unprecedented rally, reaching a new all-time high of $2,956 on Monday, February 24. But volatility is also exploding in the gold market. However, we suspect that this volatility is necessary to catapult the gold price above $3,000.
The Music is Still Playing
Despite these recent fluctuations, the overall market direction remains upward (“Melt-Up”), albeit with greatly increased volatility. As long as Trump doesn’t also fire the “Plunge Protection Team”, the upward movement in the financial markets should be able to continue at least until May or early summer, in line with the classic seasonal pattern. Overall, the crack-up boom continues.
7. Conclusion: Gold – Healthy Correction Already Overcome
The gold market has resumed its upward trend after the healthy correction phase in November and December. Since the beginning of the year, the gold bulls have driven the price up at an impressive pace.
This dramatic upward movement was supported by a spectacular combination of factors, particularly the significant shift of gold holdings from London to New York. This has led to a shortage of physically available gold in London and, for the first time in decades, has caused genuine distrust towards unallocated gold investments. This has dramatically changed the psychology of gold investors. Now, large investors want and need to ensure that their gold holdings actually exist physically!
Outlook Positive Until Late Spring/Early Summer
The sharp pullback from $2,956 to $2,832 seems to have already been overcome given the V-shaped recovery. In fact, the gold bulls are coming back into the market with force in the first week of March, once again demonstrating the impressive resilience of recent weeks. While a second corrective leg cannot be completely ruled out in the short term, the overall picture remains extremely bullish. The seasonality for the gold price indicates a possible peak between mid-March and mid-May.
Next Price Targets Above $3,000
Overall, the market development remains strongly bullish, and we expect market participants to want to see the round psychological mark of $3,000 as soon as possible. The next price target is around $3,020. Beyond that, the target from the large cup-and-handle formation of the last 14 years awaits at around $3,080! On the way there, sharp pullbacks of up to $150 can occur at any time! In general, volatility in the gold market will continue to increase.
Furthermore, we suspect that the silver price will begin a spectacular catch-up race in the coming weeks. Price targets above $40 and perhaps even around the all-time high of $50 are conceivable.
Florian Grummes
Precious Metals and Crypto Expert
Source: www.celticgold.de