
The six-month chart of the Canadian magnesium explorer West High Yield Resources (WKN A1J5LQ / TSXV WHY) shows a strong upward momentum in the last quarter of the previous year, which led the stock price slightly above but ultimately only up to the 200-day moving average. Between December and February, it moved sideways around 0.25 Canadian dollars – two slips marked a strong bottom at 0.22 CAD. For about three weeks now, the stock price has been moving upwards again with higher volumes – however, once again, the 200-day moving average (and also the purple resistance line – valid since December) has not been significantly surpassed.
The two average lines can be evaluated as neutral to slightly positive overall. The 100-day moving average has been rising again since the turn of the year, whereas the 200-day moving average, although still falling slightly, is almost moving sideways again. A crossing of the 100-day moving average through the 200-day moving average would be considered a buy signal – with continued movement, this could occur in the first half of April.
At the end of February, both the MACD (blue crosses red) and the DMI indicator (green crosses red) generated a buy signal. For the latter, the blue line indicating the strength of the trend has reached its six-month high. With the beginning of the current upward momentum, the Overbought/Oversold indicator briefly reached a value of 2.0, considered overbought. However, this was quickly reduced again – currently at 1.0, the indicator is viewed as positive but not overheated, between the neutral zero and 2.0. The Chaikin Money Flow Index, which indicates capital flow, has been running in the green (capital flowing into the stock) area since January. Upon reaching the 200-day moving average, it has currently fallen back to the neutral middle.
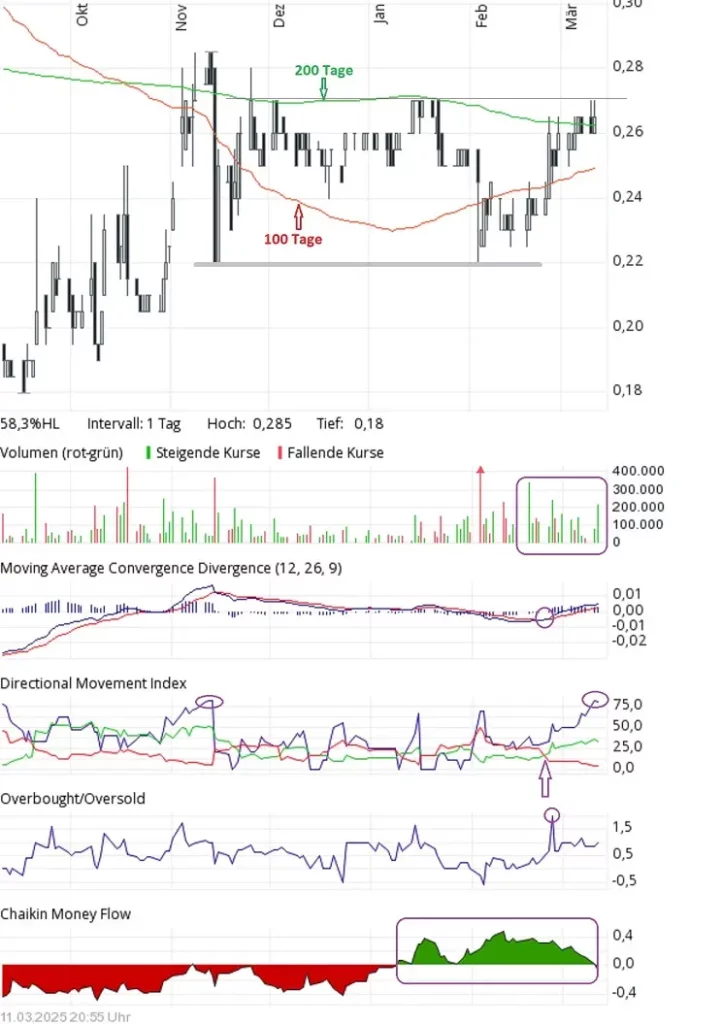
Source: Comdirect