MACD indicator generates a buy signal
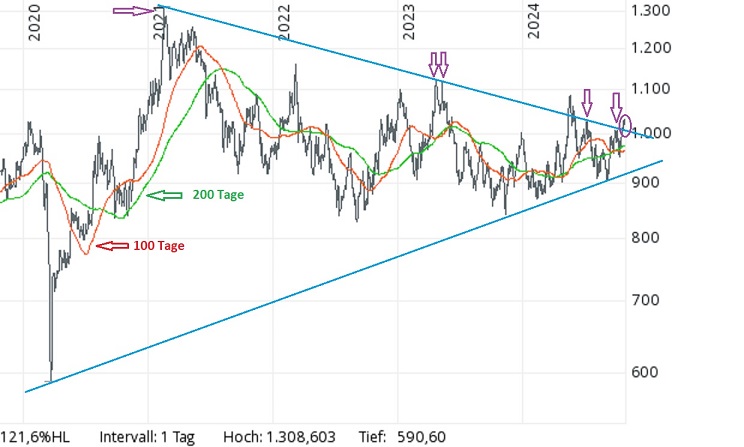
A large blue triangle formation can be seen in the five-year platinum price chart, the upper line of which has already stopped the price from rising several times. In May, this line was broken for the first time – but only for a few weeks. Currently, the platinum price has broken out upwards again – we are curious to see whether this is the start of a trend reversal.
Source: Comdirect
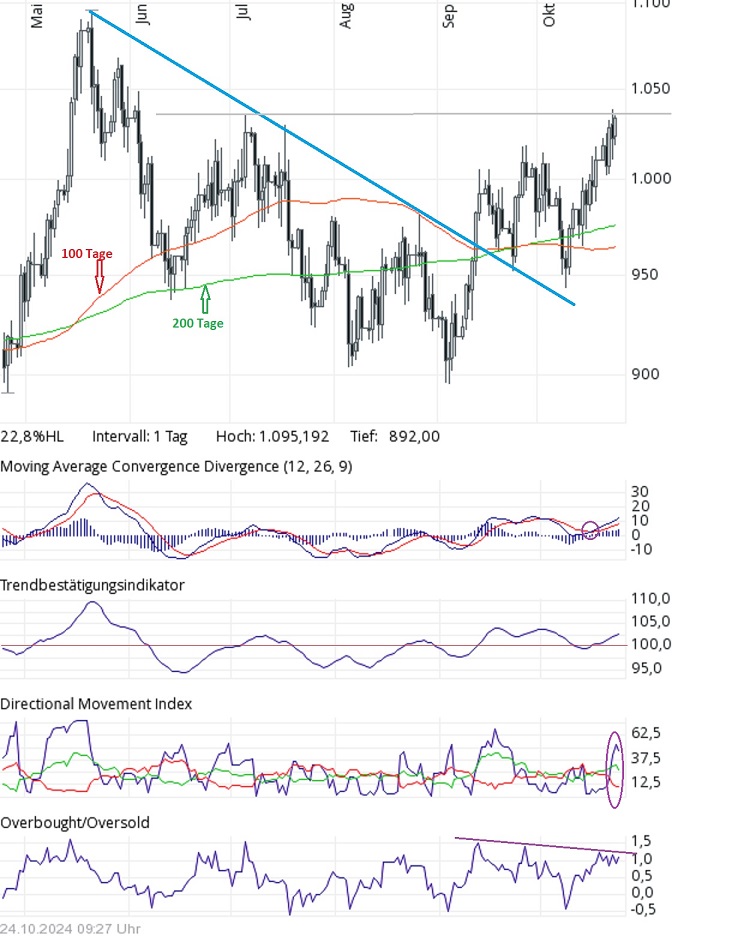
A look at the six-month chart shows that after the corrective movement below the blue downward trend line following the May top, a strong upward impulse emerged which, in addition to the trend line, was able to overcome both averages and the USD 1,000 mark. The platinum price is currently in the area of the interim high from July. If the upward trend continues, the round USD 1,050 mark and then the high from May would come into view.
Both average lines are now rising again (the 100-day line has only been rising for a few days) – this should be viewed positively. A medium-term buy signal would be generated by the upward crossing of the 100-day line through the 200-day line. This is unlikely to happen before mid-November (assuming a further price rise).
The MACD indicator gave a buy signal in the middle of the month (the blue line crosses the red line upwards). The trend confirming indicator has also been above the 100 mark in positive territory for some time (apart from a small slip two weeks ago). The more complex Directional Movement Index (DMI) indicator is also green. The green line is clearly above the red line and the trend strength indicated by the blue line has increased significantly. However, there are currently signs of a small pause in this indicator – the lines are slipping slightly. The overbought/oversold indicator is currently clearly positive with a value of 1.0, but is still well away from an overbought status (from 2.0. In addition, this indicator suggests that events are calming down due to a slight drop in the highs.
Source: Comdirect
Disclaimer: GOLDINVEST Consulting GmbH offers editors, agencies and companies the possibility to publish comments, analyses and news on https://www.goldinvest.de. These contents serve exclusively the information of the readers and do not represent any kind of call to action, neither explicitly nor implicitly they are to be understood as an assurance of possible price developments. Furthermore, they in no way replace an individual expert investment advice, it is rather promotional / journalistic publications. Readers who make investment decisions or carry out transactions on the basis of the information provided here do so entirely at their own risk. The acquisition of securities, especially with shares in the penny stock area, carries high risks, which can lead to a total loss of the invested capital. The GOLDINVEST Consulting GmbH and its authors expressly exclude any liability for financial losses or the content guarantee for topicality, correctness, adequacy and completeness of the articles offered here. Please also note our terms of use.
According to §34b WpHG and according to Paragraph 48f paragraph 5 BörseG (Austria) we would like to point out that principals, partners, authors and employees of GOLDINVEST Consulting GmbH hold or may hold shares of EcoGraf and therefore a possible conflict of interest exists. We also cannot exclude that other stock letters, media or research firms discuss the stocks we recommend during the same period. Therefore, symmetrical information and opinion generation may occur during this period. Furthermore, there is a consulting or other service contract between EcoGraf and GOLDINVEST Consulting GmbH, which means that a conflict of interest exists.
